-
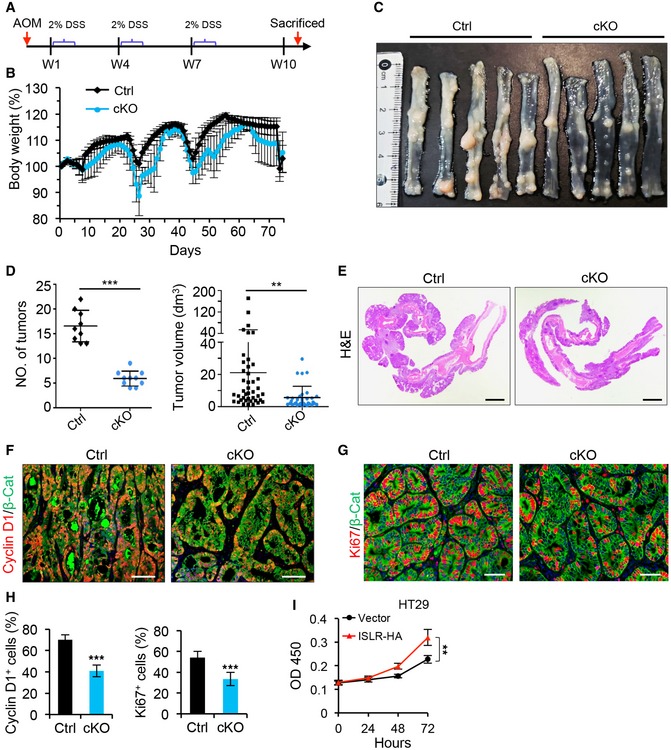
A
Schematics of generating AOM–DSS mouse colon tumor model.
-
B
Quantification of body weight changes in control (n = 9) and cKO (n = 10) mice during tumor development.
-
C
Gross images of AOM–DSS tumors in control (n = 9) and cKO (n = 10) mice.
-
D
Quantification of tumor number per mouse and tumor volume in control (n = 9) and cKO (n = 10) mice.
-
E
Histological images of colon tumors from control and cKO mice. Scale bar: 2 mm.
-
F, G
Double immunofluorescence for Cyclin D1 and β‐catenin (F), as well as Ki67 and β‐catenin (G) in colon tumors from control (n = 4) and cKO (n = 4) mice. Scale bar: 100 μm.
-
H
Quantification of percentage of Cyclin D1+ and Ki67+ cells in (F and G); n = 4.
-
I
The growth curve of HT29 CRC cells cultured in the supernatant with or without ISLR‐HA. The supernatant was collected for HT29 CRC cells 24 h after transfected with pcDNA3.1 empty vector or pcDNA3.1‐ISLR‐HA vector; n = 5 at each timepoint.
Data information: In (B, D, H, and I), data are presented as mean ± SD. **
P <
0.01; ***
P <
0.001 (Student's
t‐test).

