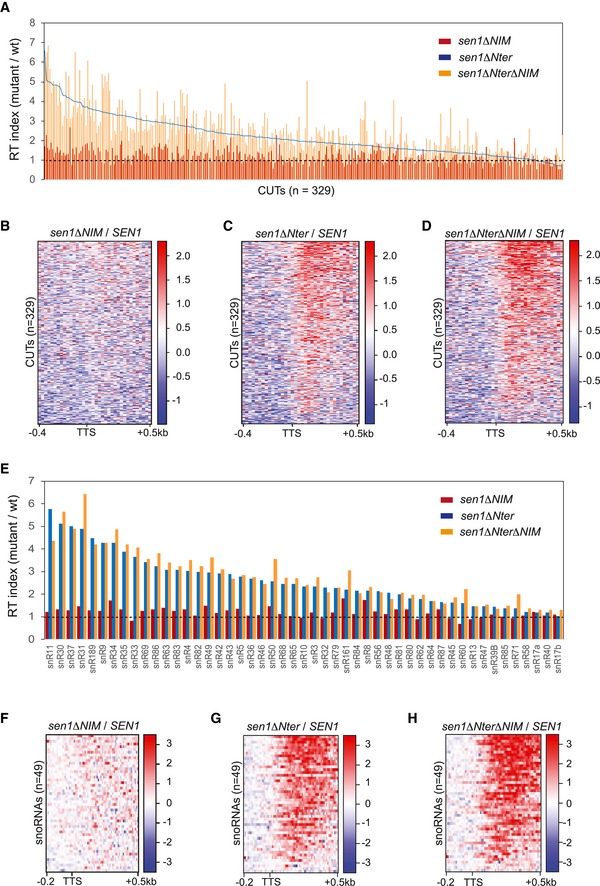
Figure EV4. Quantification of transcription termination defects detected in the different Sen1 mutants at individual ncRNAs (related to Fig 4).

-
APlot representing the RT index of the indicated mutants relative to the wt version of Sen1 for each CUT. RT indexes were calculated as in Fig 4. CUTs are ranked in the decreasing order according to corresponding value in sen1∆Nter. Data from sen1∆NIM and sen1∆Nter∆NIM are shown by vertical bars while data from sen1∆Nter are represented by a line.
-
B–DHeatmaps representing the log2 of the fold change (FC) of the RNAPII signal in the indicated mutants relative to the wt at CUTs.
-
EGraph representing the RT index, calculated as in Fig 4, of the indicated mutants relative to the wt for each snoRNA analysed.
-
F–HHeatmaps showing the log2 FC of the signal in the indicated mutants relative to the wt at snoRNAs.
