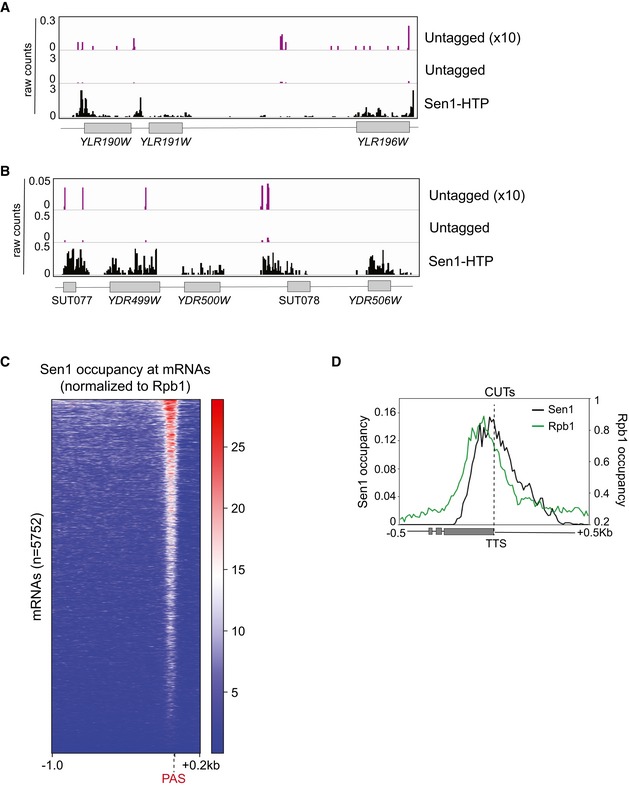
Figure EV5. Distribution of Sen1 signal at different types of RNAs (related to Fig 5).

-
A, BScreenshots of particular genomic regions to illustrate the differences in the signals obtained with the untagged control, relative to a strain expressing the HTP‐tagged version of Sen1 allowing its purification (see Methods for details). The signal of the control is multiplied by 10 to allow a better comparison with that of Sen1‐HTP. Values correspond to the data before normalization to total number of deletions. The data from one of the biological replicates of Sen1 wt is shown as Sen1‐HTP.
-
CHeatmap visualization of the distribution of Sen1 wt at mRNAs.
-
DMetagene analysis of the distribution of the different Sen1 variants at CUTs as in Fig 6J but using the TTS as reference point.
