-
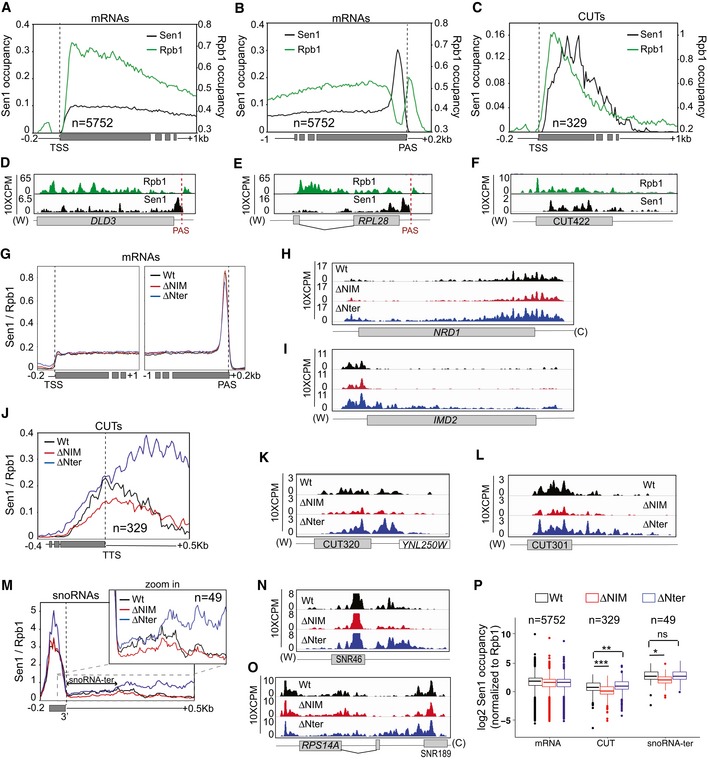
A–C
Comparison of the distribution of Sen1 and RNAPII (Rpb1) at mRNAs and CUTs. Values on the y‐axis correspond to the median coverage. Note that the scale of Sen1 and Rpb1 datasets has been modified to be able to visualize both in the same plot.
-
D–F
IGV screenshots of two mRNAs and one CUT exemplifying the trend observed in the metagene plots.
-
G
Metagene analysis of the distribution of the different Sen1 variants at mRNAs using either the TSS or the PAS as reference point. Values correspond to the median of Sen1 data normalized by the RNAPII signal obtained in the corresponding background. Additional analyses performed using the mean and using quartiles are included in
Appendix Fig S5.
-
H, I
Screenshots of two well‐characterized protein‐coding genes that are regulated by NNS‐dependent premature termination. Values correspond to unnormalized Sen1 occupancy.
-
J
Profile of Sen1 binding to CUTs calculated as for mRNAs.
-
K, L
Examples of CUTs exhibiting differences in Sen1 occupancy upon deletion of the NIM or the Nter. Plots correspond to unnormalized data.
-
M–O
Analysis of the distribution of the different Sen1 versions around snoRNAs performed as for CUTs.
-
P
Comparison of the total levels of the different Sen1 variants at mRNAs, CUTs and the termination region of snoRNAs (i.e. a window of 200 nt downstream of the 3′ end of the mature snoRNA, snoRNA‐ter). Boxes in box‐plots include all the values between the 25th and the 75th percentiles, and the horizontal line indicates the median. The upper error bars indicate the distance between the largest value smaller than or equal to the upper limit of the box + 1.5*IQR. The lower error bars indicate the distance between the lowest value greater than or equal to the lower limit of the box − 1.5*IQR. Datasets for the different Sen1 versions were compared using a t‐test (bilateral distributions, unpaired data). P‐values ≥ 0.05 are indicated as ns (not significant), one asterisk is used when 0.05 > P‐value ≥ 0.01, two asterisks when 0.01 > P‐value ≥ 0.001 and three asterisks for P‐value < 0.001.

