
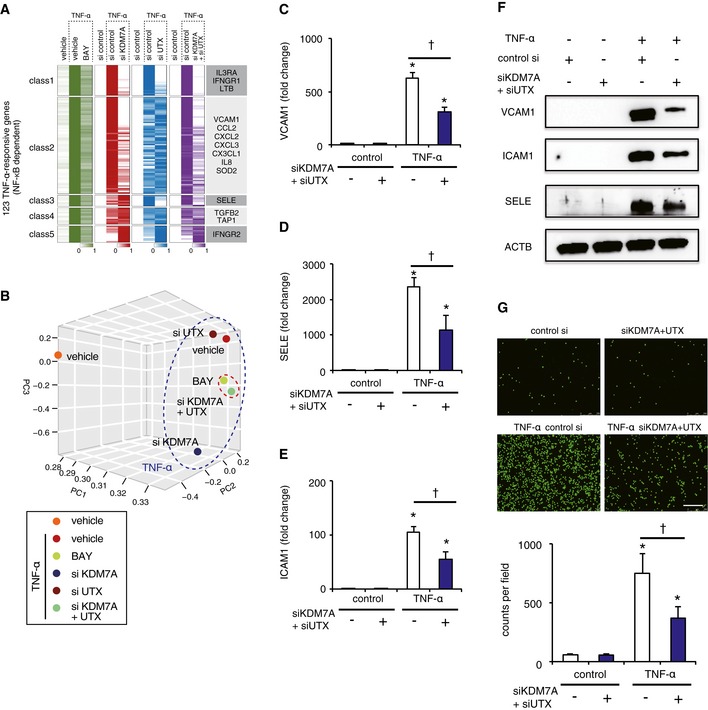
Figure 2. KDM7A and UTX participate in TNF‐α‐induced NF‐κB‐p65 signaling pathways leading to the activation of ECs.
-
AHeat map representation of RNA‐seq results. The p65‐dependent genes (total 123; defined as genes up‐regulated more than 2‐fold via TNF‐α treatment and down‐regulated more than 0.75‐fold via BAY 11–7,082 treatment) were classified based on the alteration patterns by the siRNA knockdown of KDM7A, UTX, and both, using the algorithm “HOPACH”.
-
BThree‐dimensional (3D) multidimensional scaling (MDS) plots. ECs in the presence or absence of TNF‐α ± BAY, siKDM7A, siUTX, or siKDM7A+siUTX were mapped to the 3D space, based on the expression profiles of the TNF‐α‐responsive genes, by using classical MDS. Each treated cell is represented by a colored dot.
-
C–EBar plot showing mean mRNA levels of VCAM1, ICAM1, and SELE measured 4 h after stimulation of ECs with or without TNF‐α ± (siKDM7A+siUTX). Data are shown as means ± SE (n = 3). *P < 0.05 compared to TNF‐α (−) siKDM7A+siUTX (−). † P < 0.05 compared to TNF‐α (+) siKDM7A+siUTX (−). Statistical differences were analyzed by the Tukey–Kramer test.
-
FWestern blots for VCAM1, ICAM, SELE, and ACTB in lysates from ECs treated with or without TNF‐α (4 h) ± (siKDM7A+siUTX).
-
GRepresentative images (top) and bar plot quantification (bottom) showing the adhesion of calcein‐labeled U937 monocytes to ECs treated with or without TNF‐α ± (siKDM7A+siUTX). Scale bar represents 250 μm. Graphs are representative of three independent experiments. Data are shown as means ± SD. *P < 0.05 compared to TNF‐α (−) siKDM7A+siUTX (−). † P < 0.05 compared to TNF‐α (+) siKDM7A+siUTX (−). Statistical differences were analyzed by the Tukey–Kramer test.
Source data are available online for this figure.