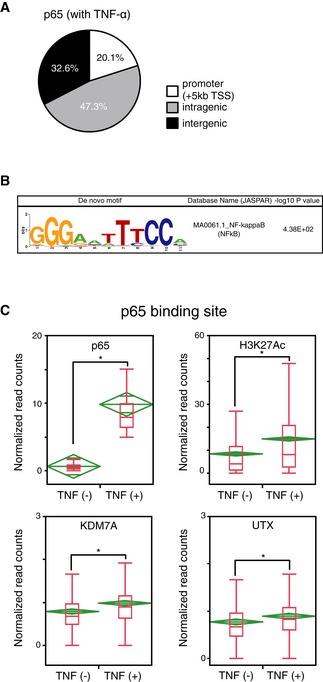
Figure EV2. Gain of KDM7A and UTX recruitment at the p65‐related elements during TNF‐α‐signaling in human ECs.

- Pie chart of p65 binding site distribution in ECs with TNF‐α (+).
- De novo motif analysis of p65 binding sequences in TNF‐α‐stimulated ECs. The P‐value indicates significant enrichment of the transcription factor binding motif in p65 binding sites in comparison to a size‐matched random background.
- Boxplots of p65, H3K27ac, KDM7A, and UTX signals at all p65 binding sites in ECs before and after TNF‐α stimulation. The Y‐axis indicates normalized read counts. The horizontal line within the box represents the median sample value. The ends of the box represent the 3rd and 1st quantiles. The whiskers extend from the ends of the box to the outermost data point that falls within the distances computed as follows: 3rd quartile +1.5* (interquartile range) and 1st quartile −1.5* (interquartile range). Mean diamonds representing confidence intervals appear. The vertical span of each diamond represents the 95% confidence interval for the mean of each group. Graphs are representative of two independent experiments. *P < 0.05 compared to TNF‐α (−). Statistical differences were analyzed by the Student's t‐test.
