-
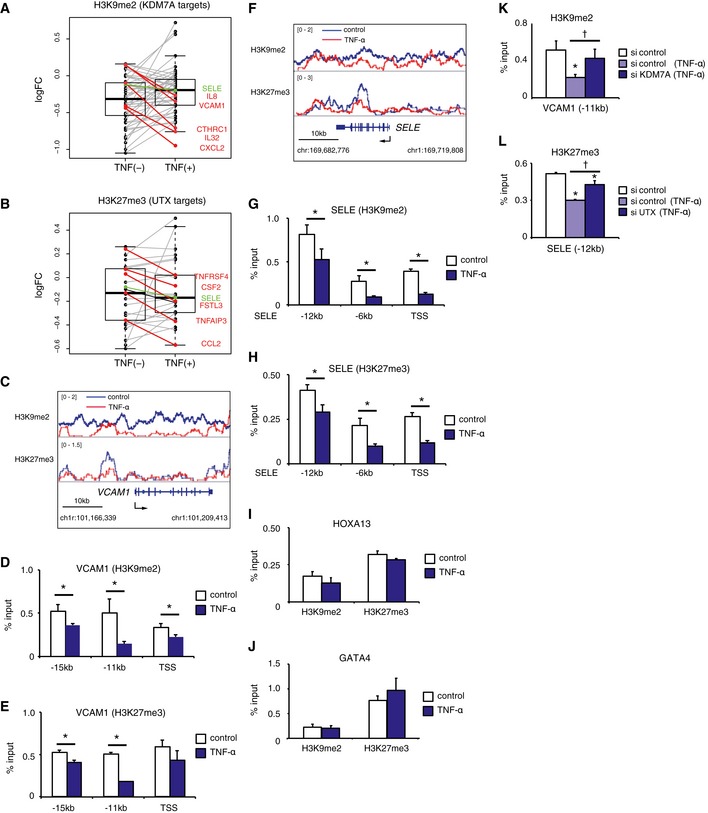
A, B
Boxplots of the log2 fold change of ChIP‐seq enrichment of H3K9me2 in KDM7A target genes (A) and that of H3K27me3 in UTX‐target genes (B) with TNF‐α treatment (TNF+) and control (TNF−). The horizontal line within the box represents the median sample value. The ends of the box represent the 3rd and 1st quantiles. The whiskers extend from the ends of the box to the outermost data point that falls within the distances computed as follows: 3rd quartile +1.5* (interquartile range) and 1st quartile −1.5*(interquartile range). Each dot in the box plot shows data for one single target gene. Genes colored red represent the top five down‐regulated target genes with TNF‐α‐treatment, as compared to control. Graphs are representative of two independent experiments.
-
C
Gene tracks of ChIP‐seq signals for H3K9me2 and H3K27me3 around the VCAM1 locus in TNF‐α (−) and TNF‐α (+) ECs.
-
D, E
ChIP‐qPCR showing enrichment (percent input) of H3K9me2 (D) and H3K27me3 (E) around the VCAM1 locus. Primer pairs targeting distinct regions are listed on the X‐axis. Graphs are representative of three independent experiments. Data are shown as means ± SD. *P < 0.05 compared to TNF‐α (−). Statistical differences were analyzed by the Student's t‐test.
-
F
Gene tracks of ChIP‐seq signals for H3K9me2 and H3K27me3 around the SELE locus in TNF‐α (−) and TNF‐α (+) ECs.
-
G, H
ChIP‐qPCR showing enrichment (percent input) of H3K9me2 (G) and H3K27me3 (H) around the SELE locus. Primer pairs targeting distinct regions are listed on the X‐axis. Graphs are representative of three independent experiments. Data are shown as means ± SD. *P < 0.05 compared to TNF‐α (−). Statistical differences were analyzed by the Student's t‐test.
-
I, J
ChIP‐qPCR showing enrichment (percent input) of H3K9me2 and H3K27me3 around the HOXA13 (I) and GATA4 (J) loci. Graphs are representative of three independent experiments. Data are shown as means ± SD. *P < 0.05 compared to TNF‐α (−). Statistical differences were analyzed by the Student's t‐test.
-
K, L
ChIP‐qPCR showing enrichment (percent input) of H3K9me2 around VCAM1 ‐11 kb (K) and H3K27me3 around SELE ‐12 kb (L). Graphs are representative of three independent experiments. Data are shown as means ± SD. *P < 0.05 compared to TNF‐α (−). †
P < 0.05 compared to TNF‐α (+) siKDM7A (−) or TNF‐α (+) siUTX (−). Statistical differences were analyzed by the Tukey–Kramer test.