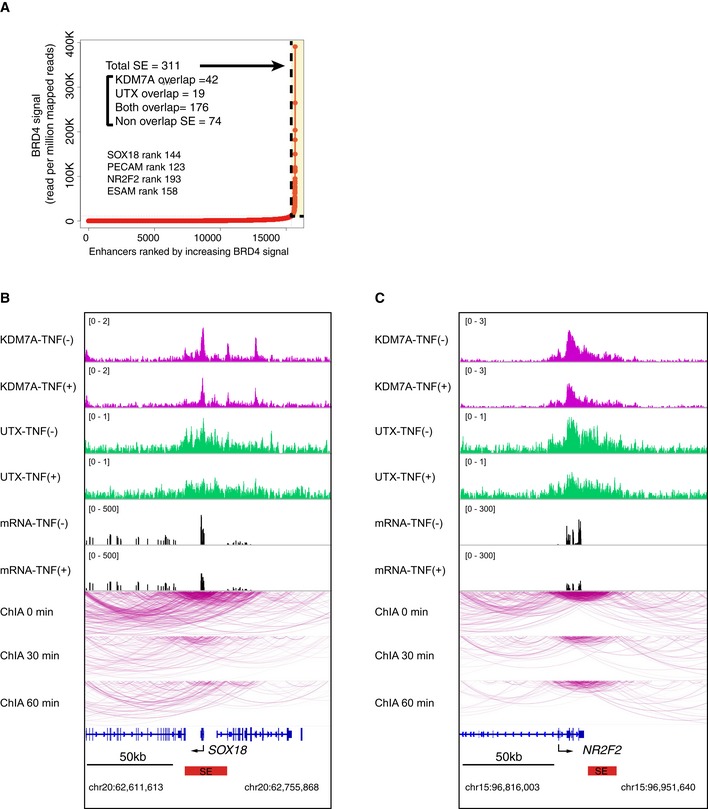
Figure EV4. KDM7A and UTX‐ recruitment correlated with SEs in resting human ECs.

-
APlot of enhancers defined in TNF‐α‐untreated ECs, ranked by increasing BRD4 signal. Super enhancers (SEs) were defined by ROSE (Loven et al, 2013; Whyte et al, 2013), based on the ChIP‐Seq signals for BRD4 (Brown et al, 2014b). SEs are indicated by dashed lines and yellow boxes. The numbers denote the total SEs and their classification based on the binding of KDM7A and UTX. Representative SE‐related genes are indicated in the graph.
-
B, CChIA‐PET interactions of active RNA pol II around the SOX18 (B) and NR2F2 (C) loci integrated with the ChIP‐seq profiles of KDM7A and UTX, and the RNA‐seq profiles in TNF‐α (−) and TNF‐α (+) ECs. ChIA‐PET interactions were visualized by the WashU Epigenome Browser (http://epigenomegateway.wustl.edu/browser/). Interactions detected by ChIA‐PET are depicted with purple lines. Red bars show control‐specific SEs.
