
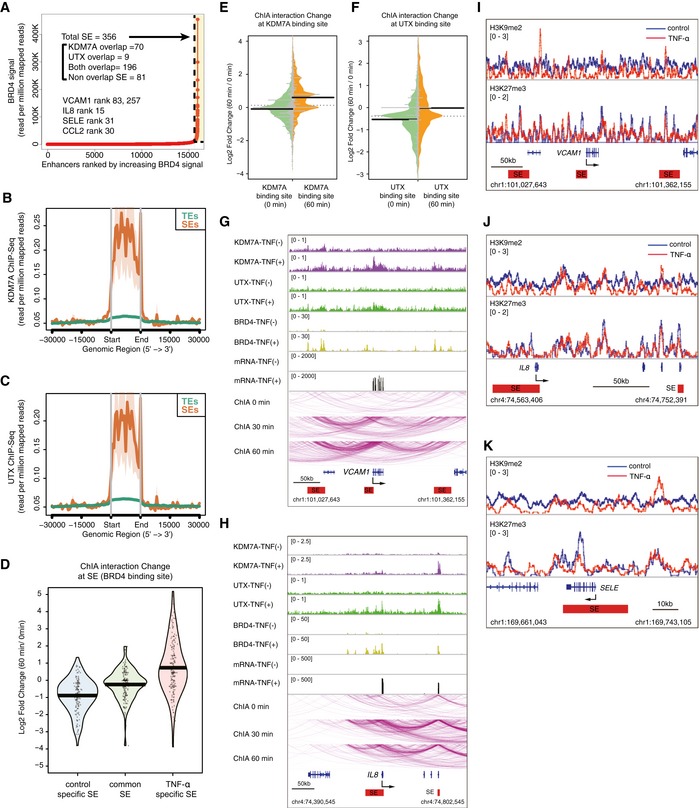
Figure 5. The recruitment of KDM7A and UTX is associated with the formation of TNF‐α‐induced SEs and their associated chromatin loop formation.
-
APlot of enhancers defined in TNF‐α‐treated ECs, ranked by increasing bromodomain‐containing protein 4 (BRD4) signal. Super enhancers (SEs) were defined by ROSE (Loven et al, 2013; Whyte et al, 2013), based on the ChIP‐Seq signals for BRD4 (Brown et al, 2014b). SEs are indicated by dashed lines and are colored yellow. The numbers show the total SEs and their classification based on KDM7A and UTX binding. Representative SE‐related genes are indicated in the graph.
-
B, CMetagene representations of KDM7A (B) and UTX (C) ChIP‐seq signals in units of read count per million mapped reads, at a meta composite of SEs and typical enhancers (TEs). TEs were obtained from the pre‐compiled HUVEC ngsplotdb (https://github.com/shenlab-sinai/ngsplot).
-
DPirate plots showing ChIA‐PET interaction changes at control‐specific, common, and TNF‐α‐specific SEs. The Y‐axis indicates the log2 ratio of ChIA‐PET signals (TNF‐α 60 min/0 min). The central bar indicates the average.
-
E, FBean plots showing ChIA‐PET interaction changes at KDM7A (E) and UTX (F) binding sites. The Y‐axis indicates the log2 ratio of ChIA‐PET signals (TNF‐α 60 min/0 min). The central bar indicates the median.
-
G, HChIA‐PET interactions of active RNA pol II around the VCAM1 (G) and IL8 (H) loci integrated with the ChIP‐seq profiles of KDM7A, UTX, and BRD4, and RNA‐seq profiles in TNF‐α (−) and TNF‐α (+) ECs. ChIA‐PET interactions were visualized by the WashU Epigenome Browser (http://epigenomegateway.wustl.edu/browser/). Interactions detected by ChIA‐PET are depicted with purple lines. Red bars show TNF‐α‐specific SEs.
-
I–KGene tracks of ChIP‐seq signals for H3K9me2 and H3K27me3 around VCAM1 (I), IL8 (J), and SELE (K) in TNF‐α (−) and TNF‐α (+) ECs. Red bars show TNF‐α‐specific SEs.
Source data are available online for this figure.