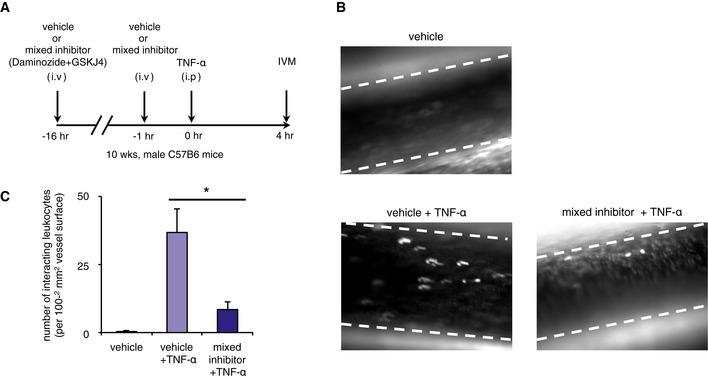
Figure 6. KDM7A and UTX are important for leukocyte adhesion in mice.

- Drug administration protocol for intravital microscopy (IVM) experiments. Male, 10‐week‐old C57BL/6 mice (n = 3/group) were pretreated with vehicle or mixed inhibitor (Daminiozed+GSKJ4, 50 mg/kg each) at 16 h and 1 h prior to TNF‐α treatment. Inflammation was induced by an intraperitoneal injection of TNF‐α (5 μg/mouse), and IVM was performed 4 h later.
- Representative snapshot from the IVM analysis of leukocyte adhesive interactions in the femoral arteries. Margins of vessels are indicated with dashed lines. White spots represent fluorescently labeled leukocytes visualized by the intravenous injection of rhodamine 6G.
- Quantitative analyses of leukocyte adhesive interactions in the femoral arteries. Data are shown as means ± SE (n = 3/group). *P < 0.05 compared to the vehicle + TNF‐α group. Statistical differences were analyzed by the Student's t‐test. See also Movies EV1 and EV2.
