-
A, B
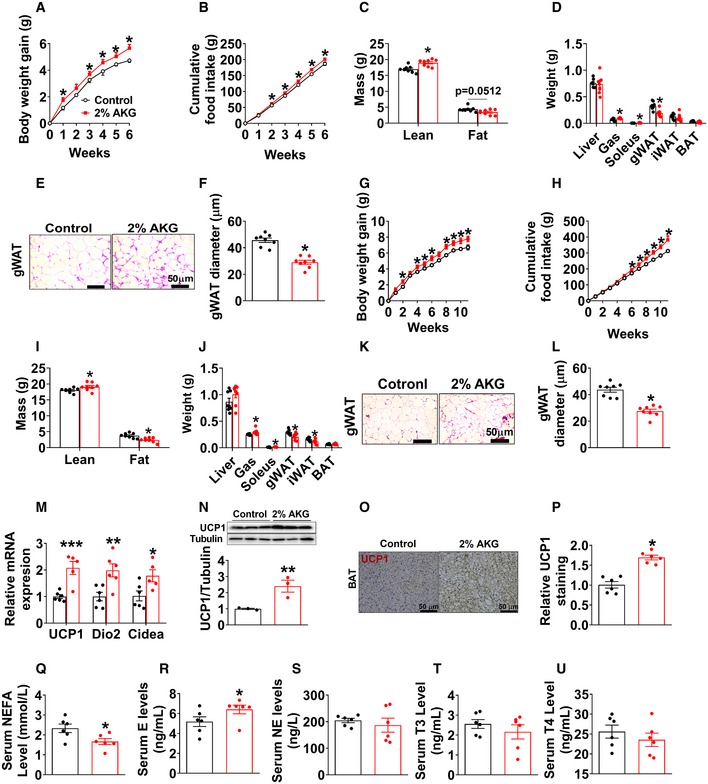
Body weight gain (A) and cumulative food intake (B) of male C57BL/6 mice. At 12 weeks of age, chow‐fed male mice were divided into two groups receiving tap water or water supplemented with 2% AKG for 6 weeks (n = 8 per group).
-
C, D
Body composition (C) and tissue weight (D) of male mice treated with AKG for 6 weeks (n = 7–8 per group).
-
E, F
Representative images (E) and quantification (F) of gWAT HE staining from male mice treated with AKG for 6 weeks (n = 8 per group).
-
G, H
Body weight gain (G) and cumulative food intake (H) of female C57BL/6 mice. At 12 weeks of age, chow‐fed female mice were divided into two groups receiving tap water or water supplemented with 2% AKG for 11 weeks (n = 8 per group).
-
I, J
Body composition (I) and tissue weight (J) of female mice treated with AKG for 11 weeks (n = 8 per group).
-
K, L
Representative images (K) and quantification (L) of gWAT HE staining from female mice treated with AKG for 11 weeks (n = 8 per group).
-
M
The mRNA expression of thermogenic genes in BAT of male C57BL/6 mice supplemented with AKG for 6 weeks (n = 6 per group).
-
N–P
Immunoblots and quantification of UCP1 (N) and representative images of DAB staining (O) and quantification (P) of UCP1 in BAT of male mice supplemented with AKG for 6 weeks (n = 3–6 per group).
-
Q–U
Serum levels of NEFA (Q), E (R), NE (S), T3 (T), and T4 (U) in male mice supplemented with AKG for 6 weeks (n = 6 per group).
Data information: Results are presented as mean ± SEM. In (A, B, G and H), *
P ≤ 0.05 by two‐way ANOVA followed by post hoc Bonferroni tests. In (C, D, F, I, J, L–N and P–U), *
P ≤ 0.05, **
P ≤ 0.01, and ***
P ≤ 0.01 by non‐paired Student's
t‐test.
Source data are available online for this figure.

