-
A
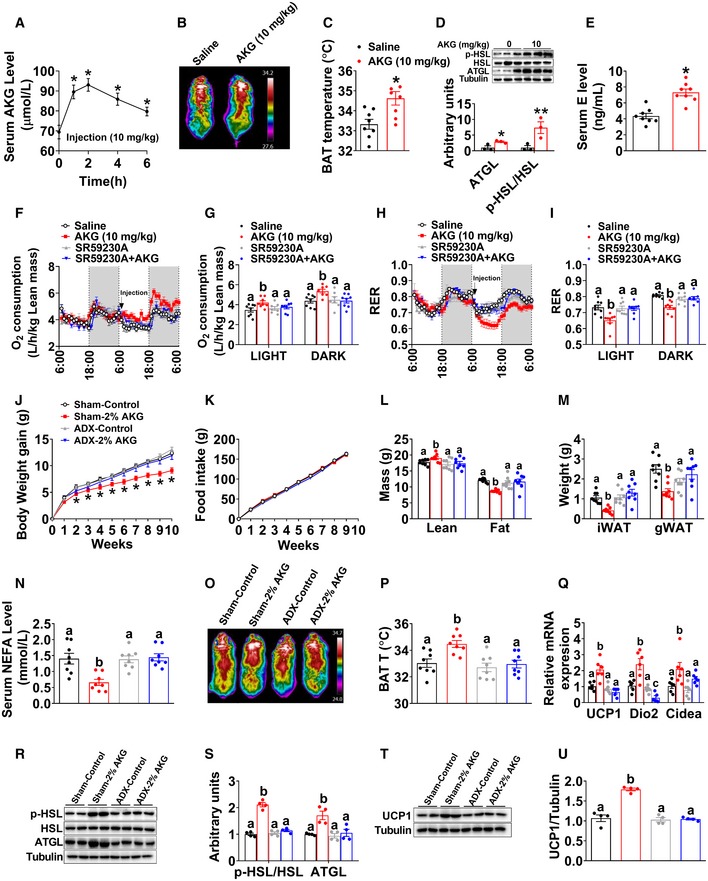
Serum AKG concentration–time profile obtained from male C57BL/6 mice (10 weeks old) fed with normal chow before or after i.p AKG (10 mg/kg body weight). The serum AKG level was tested at 0, 1, 2, 4, and 6 h after injection (n = 8 per group).
-
B, C
Representative images (B) and quantification (C) of BAT thermogenesis after 6‐h cold exposure at 4°C. Male C57BL/6 mice (10 weeks old) were i.p. injected with 10 mg/kg AKG or saline and immediately exposed to cold stress at 4°C (n = 8 per group).
-
D
Immunoblots and quantification of p‐HSL and ATGL in the gWAT of male C57BL/6 mice (10 weeks old) 3 h after i.p. injection of 10 mg/kg AKG or saline (n = 3 per group).
-
E
Serum E level in AKG‐treated male mice 3 h after i.p. injection (n = 8 per group).
-
F–I
Oxygen consumption (F‐G) and RER (H‐I) in male C57BL/6 mice (10 weeks old) i.p. injected with saline, 10 mg/kg AKG, 1 mg/kg SR59230A (ADRB3 inhibitor), or AKG + SR59230A (n = 8 per group). All injections were performed at 7:00 am of the second day. Data are summarized in bar graph (G and I) by light or dark cycle of the second day.
-
J–N
Body weight gain (J), cumulative food intake (K), body composition (L), fat weight (M), and serum NEFA (N) of sham or adrenalectomized male C57BL/6 mice. Male mice were adrenalectomized at 8 weeks of age. Two weeks after surgeries, male mice were switched to HFD and given free access to tap water or 2% AKG for 9 weeks (n = 8 per group).
-
O, P
Representative images (O) and quantification (P) of BAT thermogenesis after 6‐h cold exposure at 4°C in sham or adrenalectomized male mice treated with AKG for 9 weeks (n = 8 per group).
-
Q
The mRNA expression of thermogenic genes in the BAT of sham or adrenalectomized male mice treated with AKG for 9 weeks (n = 6 per group).
-
R, S
Immunoblots (R) and quantification (S) of p‐HSL and ATGL protein in the gWAT of sham or adrenalectomized male mice treated with AKG for 9 weeks (n = 4 per group).
-
T, U
Immunoblots (T) and quantification (U) of UCP1 protein in the BAT of sham or adrenalectomized male mice treated with AKG for 9 weeks (n = 4 per group).
Data information: Results are presented as mean ± SEM. In (A), *
P ≤ 0.05 by non‐paired Student's
t‐test compared with before injection. In (C–E), *
P ≤ 0.05 and **
P ≤ 0.01 by non‐paired Student's
t‐test. In (J, K), *
P ≤ 0.05 by two‐way ANOVA followed by post hoc Bonferroni tests. In (G, I, L–N, P, Q, S and U), different letters between bars indicate
P ≤ 0.05 by one‐way ANOVA followed by post hoc Tukey's tests.
Source data are available online for this figure.

