-
A–H
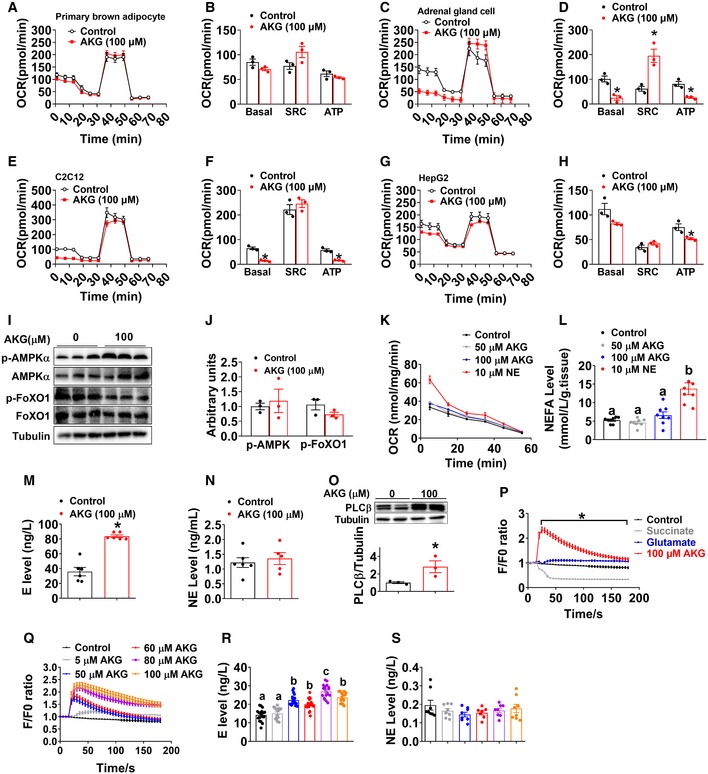
Oxygen consumption rate (OCR) of primary brown adipocyte (A, B), adrenal chromaffin cell line (C, D), C2C12 cell line (E, F), and HepG2 cell line (G, H) treated with vehicle or 100 μM AKG for 3 h (n = 3 per group). OCR was monitored using the Agilent Seahorse XFp analyzer with the sequential injection of oligomycin, FCCP, and rotenone/antimycin.
-
I, J
Immunoblots (I) and quantification (J) of p‐AMPKα and p‐FoxO1 in primary brown adipocytes treated with vehicle or 100 μM AKG (n = 3 per group).
-
K
Oxygen consumption rate (OCR) of ex vivo BAT cultured with vehicle, 50 μM AKG, 100 μM AKG, or 10 μM NE for 5, 15, 25, 25, 45, and 55 min (n = 3 per group).
-
L
Medium NEFA level from ex vivo BAT treated with vehicle, 50 μM AKG, 100 μM AKG, or 10 μM NE for 30 min (n = 6 per group).
-
M, N
Medium E (M) and NE (N) levels from ex vivo adrenal gland treated with vehicle or 100 μM AKG for 30 min in vitro (n = 5–6 per group).
-
O
Immunoblots and quantification of PLCβ in ex vivo adrenal gland treated with vehicle or 100 μM AKG for 30 min in vitro (n = 3 per group).
-
P
Intracellular calcium ion [Ca2+] changes in in vitro adrenal chromaffin cells treated with vehicle, 100 μM AKG, 100 μM succinate, or 100 μM glutamine (n = 30 per group).
-
Q
Intracellular calcium ion [Ca2+] changes in in vitro adrenal chromaffin cells treated with vehicle or 5, 50, 60, 80, or 100 μM AKG (n = 30 per group).
-
R, S
Medium E (R) or NE (S) level from in vitro adrenal chromaffin cells treated with vehicle or 5, 50, 60, 80, or 100 μM AKG for 30 min (n = 8–18 per group).
Data information: Results are presented as mean ± SEM. In (B, D, F, H, J, and M–O), *
‐test. In (K and P–Q), *
≤ 0.05 by two‐way ANOVA followed by post hoc Bonferroni tests. In (L and R–S), different letters indicate significant differences between groups by one‐way ANOVA followed by post hoc Tukey's tests.

