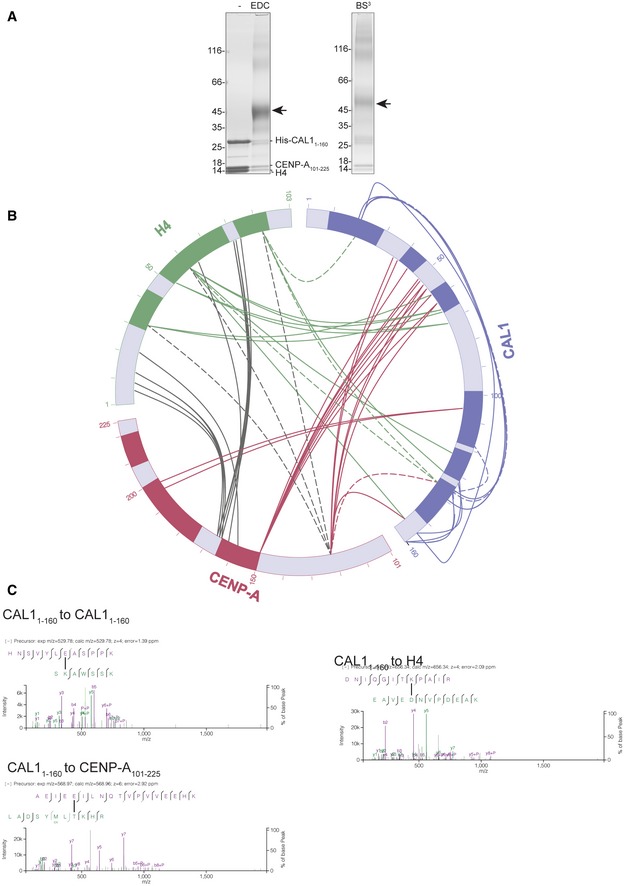
Figure EV3. Intra‐ and intermolecular contacts identified between CAL1 and CENP‐A/H4 using cross‐linking mass spectrometry (CLMS).

- SDS–PAGE analysis of His‐CAL11–160‐CENP‐A101–225‐H4 cross‐linked with both EDC (left) and BS3 (right) cross‐linker.
- Linkage map showing the sequence position and cross‐linked residue pairs between His‐CAL11–160, CENP‐A101–225 and H4. Cross‐linked samples were resolved with SDS–PAGE and then analysed by MS. CAL1 is shown in blue, CENP‐A in maroon and H4 in green. Solid lines represent EDC cross‐links, while dashed lines show BS3 cross‐links.
- High‐resolution representative fragmentation spectra displayed using XiSpec (Ref: PMID: 29741719) for cross‐linked peptides seen between CAL11–160 and CAL11–160, CAL11–160 and CENP‐A101–225 and CAL11–160 and H4.
