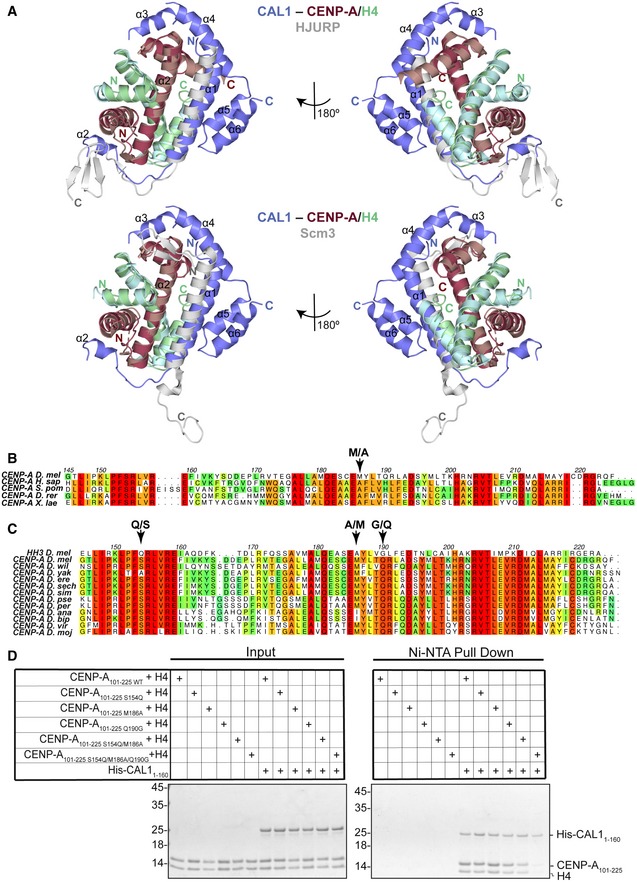
Figure 4. CAL1 uses evolutionarily conserved and adaptive structural interactions to recognise Drosophila CENP‐A/H4.

-
AUpper panel shows structure of His‐CAL11–160–CENP‐A144–225–H4 superimposed with the structure of human HJURP–CENP‐A/H4 (Hu et al, 2011). CAL1 is shown in blue, CENP‐A in maroon, H4 in green and HJURP shown in silver. Lower panel shows structure of His‐CAL11–160–CENP‐A144–225–H4 superimposed with the structure of yeast Scm3–CENP‐A/H4 (Cho & Harrison, 2011). CAL1 is shown in blue, CENP‐A in maroon, H4 in green and Scm3 shown in silver.
-
B, CMultiple sequence alignment performed with MUSCLE (Madeira et al, 2019) showing (B) conservation of CENP‐A homologues in different species, (C) conservation of CENP‐A homologues in different fly species in comparison with dm H3. Numbering corresponds to Drosophila melanogaster CENP‐A. Homo sapiens (H. sap), Schizosaccharomyces pombe (S. pom), Danio rerio (D. rer), Xenopus laevis (X. lae), Drosophila melanogaster (D. mel), Drosophila willistoni (D. wil), Drosophila yakuba (D. yak), Drosophila erecta (D. ere), Drosophila sechellia (D. sech), Drosophila simulans (D. sim), Drosophila pseudoobscura pseudoobscura (D. pse), Drosophila persimilis (D. per), Drosophila ananassae (D. ana), Drosophila bipectinata (D. bip), Drosophila virilis (D. vir) and Drosophila mojavensis (D. moj).
-
DNi‐NTA pull‐down of His‐CAL11–160 WT with corresponding CENP‐A101–225–H4 mutants. SDS–PAGE shows input and protein bound to beads. Quantifications shown in Fig EV4D.
