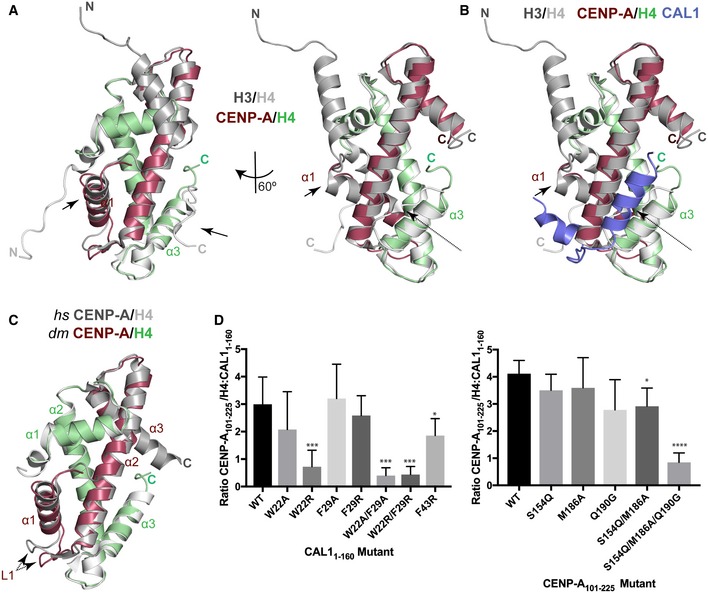
Structural superposition of CENP‐A/H4 with H3/H4 (Clapier
et al,
2008). CENP‐A is shown in maroon, H4 in green and H3/H4 in silver. Arrows indicate conformational changes.
Structural superposition of CAL1–CENP‐A/H4 (form I) with H3/H4 (Clapier
et al,
2008). CAL1 is shown in blue, CENP‐A in maroon, H4 in green and H3/H4 in silver. Arrows indicate conformational changes; dotted arrow highlights conformational changes in the loop regions.
Structural superposition of
hs CENP‐A/H4 (Sekulic
et al,
2010) with
dm CENP‐A/H4.
dm CENP‐A in maroon,
dm H4 in green and
hs CENP‐A/H4 in silver. Dotted arrow highlights conformational changes in the loop regions.
(left panel) Quantifications of Ni‐NTA pull‐down of His‐CAL11–160 WT and indicated mutants with CENP‐A101–225–H4. Bar graph shows average ratio of the band intensities between CENP‐A101–225/H4 and His‐CAL11–160 (n = 7 experiments). (right panel) Quantifications of Ni‐NTA pull‐down of His‐CAL11–160 WT with CENP‐A101–225–H4 and indicated mutants. Bar graph shows average ratio of the band intensities between CENP‐A101–225/H4 and His‐CAL11–160 (n = 4 experiments).
Data information: In (D), (left panel) data presented as mean ± SD of 7 experiments,
P‐values were calculated using a Mann–Whitney test. (right panel) Data presented as mean ± SD of 4 experiments,
P‐values were calculated using unpaired two‐tailed
t‐test. (*
P < 0.05, ***
P < 0.001, ****
P < 0.0001).

