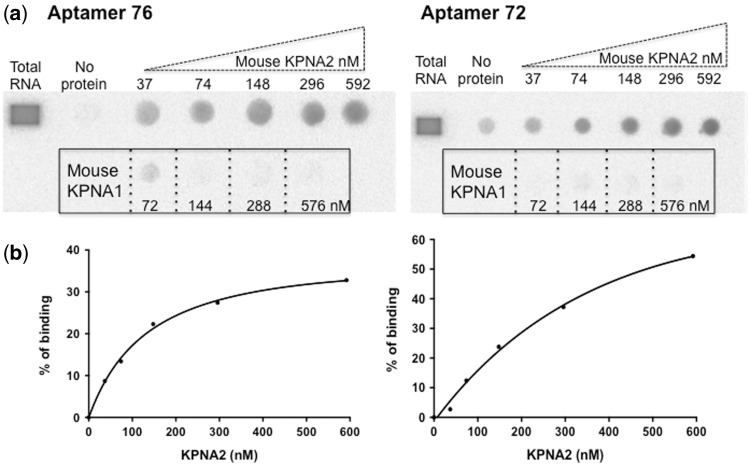
Fig. 2.
Evaluation of the binding efficiency of the selected aptamers to mouse KPNA2 and KPNA1. (a) Filter binding assay showing the labeled aptamers binding to mouse KPNA2 at various concentrations. The framed region shows that the aptamers’ binding ability to mouse KPNA1, at the indicated concentrations. (b) The amount of aptamer–KPNA2 complex retained on the filter was quantified at different concentrations of mouse KPNA2, and the dissociation constant (Kd) was determined using GraphPad Prism 6.0 nonlinear regression algorithm (GraphPad Software).

