
2.
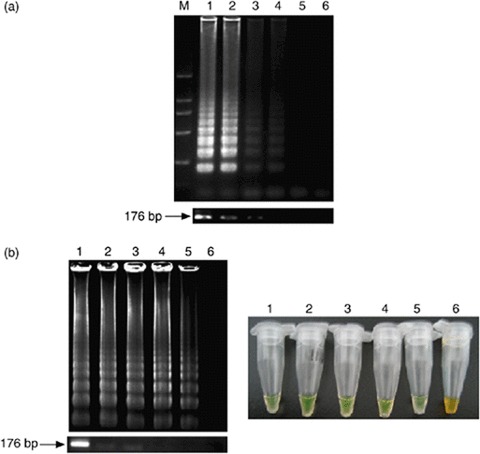
Comparative sensitivities of visual inspection and electrophoretic analyses of LAMP and PCR for the detection of Alexandrium minutum. (a) The number above each lane represents the dilution of the purified A. minutum DNA: lane M, 2-kb ladder used as a size marker; lanes 1-6, DNA of A. minutum at 1, 100, 10, 1 pg per tube, 100 and 10 fg per tube, respectively. The lower figures are electrophoretic data from the PCR analysis. PCR shows a 176-bp amplification product. (b) Lane M, 2-kb ladder used as a size marker; lanes 1–6, dilution of the A. minutum cells (DNA extracted by boiling) at 500, 100, 50, 10, 5 and 1 cells/tube, respectively. The right figure is the visual inspection of the LAMP products following the addition of SYBR Green I. The lower figure is the sensitivity of PCR for the detection of A. minutum cells as observed by agarose gel analysis.