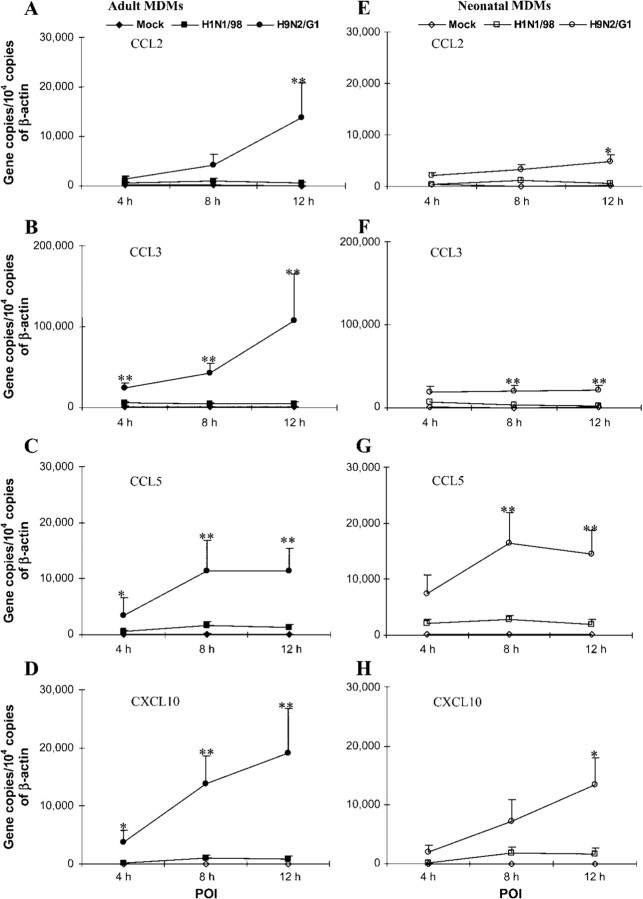
Figure 2.
Kinetics of CCL2, CCL3, CCL5, and CXCL10 mRNA expression in influenza virus–infected adult and neonatal monocyte-derived macrophages (MDMs). The graphs depict the kinetics of CCL2, CCL3, CCL5, and CXCL10 mRNA expression in mock-infected, H1N1/98-infected, and H9N2/G1-infected adult MDMs (A–D) and neonatal MDMs (E–H). After influenza virus infection, total RNA was harvested at the 4-h, 8-h, and 12-h points of infection (POIs). The target genes were quantified by quantitative reverse-transcription polymerase chain reaction and normalized to 104 copies of β-actin mRNA. The data shown are the mean±SE from 6 sets of independent experiments. In contrast to H1N1/98, avian influenza virus H9N2/G1 induced higher levels of CCL2, CCL3, CCL5, and CXCL10. *P<.05; **P<.01

