Figure 3.
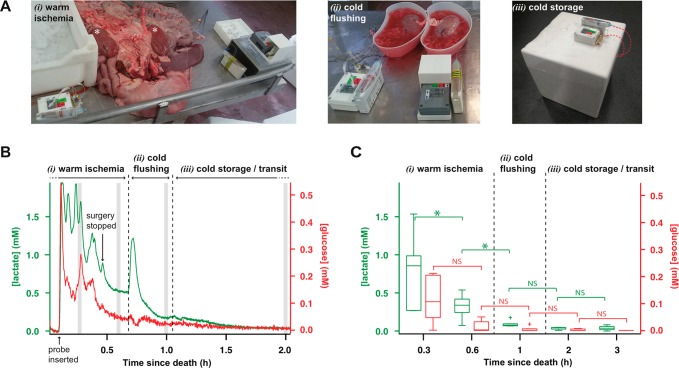
(A) Pictures of the kidney monitoring setup (i) during passive warm ischemia immediately following organ retrieval before dissection away from the other internal organs (kidneys indicated by white asterisks), (ii) during cold flushing, and (iii) during cold storage for one kidney during transit. (B) Dialysate glucose (red) and lactate (green) levels of a porcine kidney recorded online immediately after retrieval and during transit for a kidney subjected to passive warm ischemia, cold flushing, and cold storage. Online data was sampled at 10 Hz and smoothed with a Savitzky-Golay 201-point filter. Gray strips indicate the 2 min intervals at which the data was averaged to give the box plot shown in (C). (C) Dialysate glucose (red) and lactate (green) levels for six kidneys at five time-points over the 3 h following pig death. Box plots show median levels and interquartile range. Whiskers indicate 10th and 90th percentiles. Wilcoxon signed-rank test (lactate n = 6, glucose n = 5, as for one kidney the glucose levels were so low they were indistinguishable from noise), significance: *p < 0.05, NS = not significant.

