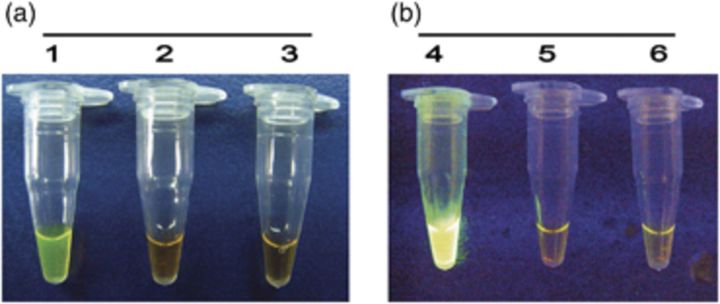
Figure 2.
Visual appearance of LAMP reactions from isolates after addition of SYBR Green I. (a) Positive reaction (tube 1), negative reaction (tube 2) and tube without DNA templates (tube 3). (b) Under UV transillumination, positive reaction (tube 4), negative reaction (tube 5) and tube without DNA templates (tube 6).

