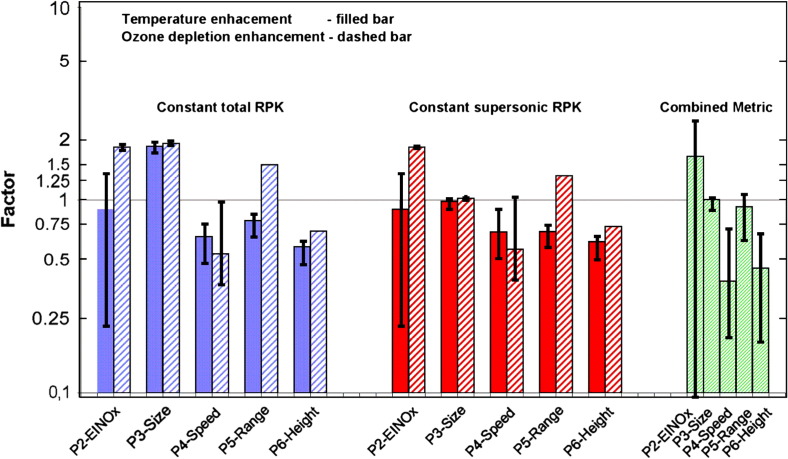
Fig. 23.
Changes in global mean surface temperature for the year 2100 (solid bars) and for O3 (dashed bars) for constant revenue passenger kilometres (RPK) of the total fleet (blue) and constant HSCT RPK (red). The product of both factors is added (green) for constant HSCT RPK. For each bar an uncertainty range is given, which represents minimum and maximum values. No bars are added when only one model has calculated chemical perturbations. In those cases the same uncertainty range has been assumed as for P4 for the calculation of the uncertainty of the product (Grewe et al., 2007).

