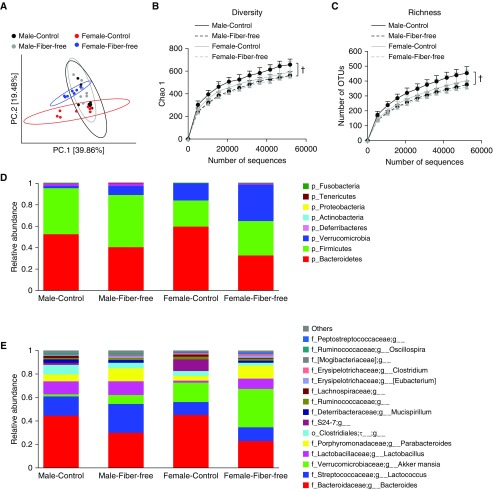
Figure 4.
Differences in gut microbiomes of male and female mice fed control or fiber-free diet for 3 days as assessed by 16S rRNA sequencing of fecal DNA. Fecal pellets were harvested before exposure. (A) Principal coordinate analysis calculated by Bray-Curtis distances. (B) Rarefaction curves of diversity on Chao 1 index. (C) Rarefaction curve of richness. (D) Relative abundance of bacterial phyla. (E) Relative abundance of top 15 genus-level taxa. n = 8 mice per group. †P < 0.05 compared with control diet–fed mice.

