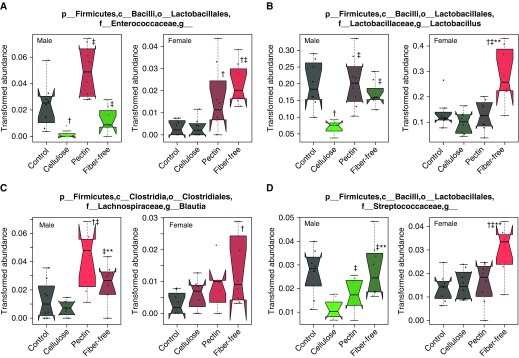
Figure 5.
Relative abundances of taxa that associated with O3-induced airway hyperresponsiveness. Analysis was performed using Multivariate Association with Linear Models (35). (A) Enterococcaceae. (B) Lactobacillus. (C) Blautia. (D) Streptococcaceae. The trapezoid boxes indicate the 25th and 75th percentiles. The whiskers indicate the minimum and maximum values, and each dot denotes one mouse. Tukey’s notches on either side of the median line indicate within-sample variance. Red means higher abundance than in mice fed a control diet, and green means lower relative abundance than in mice fed a control diet. n = 8 mice/group. †P < 0.05 and q < 0.25 compared with control diet–fed mice, ‡P < 0.05 and q < 0.25 compared with cellulose-enriched diet–fed mice, and **P < 0.05 and q < 0.25 compared with pectin-enriched diet–fed mice.

