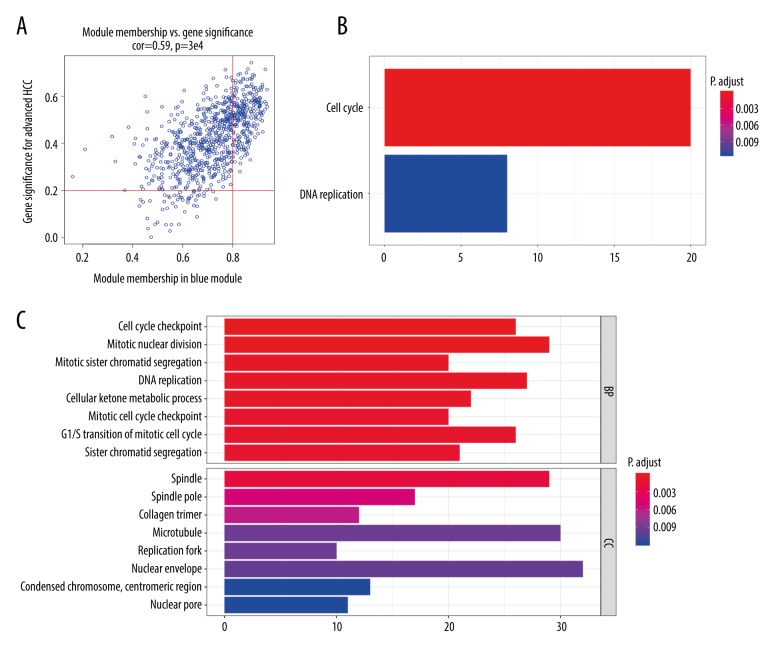
Figure 2.
Recognition of modules related to HCC and functional enrichment analysis. (A) Scatter plot of module eigengenes in blue module. The red vertical line means the threshold of module membership=0.8, the red horizontal line indicates the threshold of gene significances in pathologic stage=0.2. Genes on upper right were selected out. (B) KEGG pathway enrichment analysis of genes in blue module. (C) Gene ontology analysis of genes in blue module.

