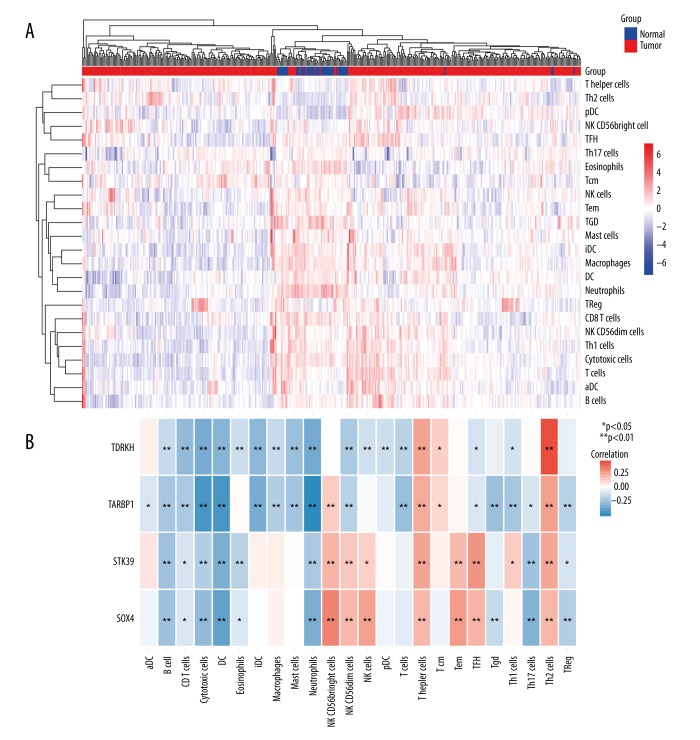
Figure 5.
Analysis of the correlation between expression of hub genes and immune infiltration level. (A) Unsupervised clustering from TCGA database using ssGSEA analysis. (B) The correlation index between expression of hub genes and immune infiltration level. Red/blue color represents positive/negative correlation, and the correlation index is reflected by the depth of the color.

