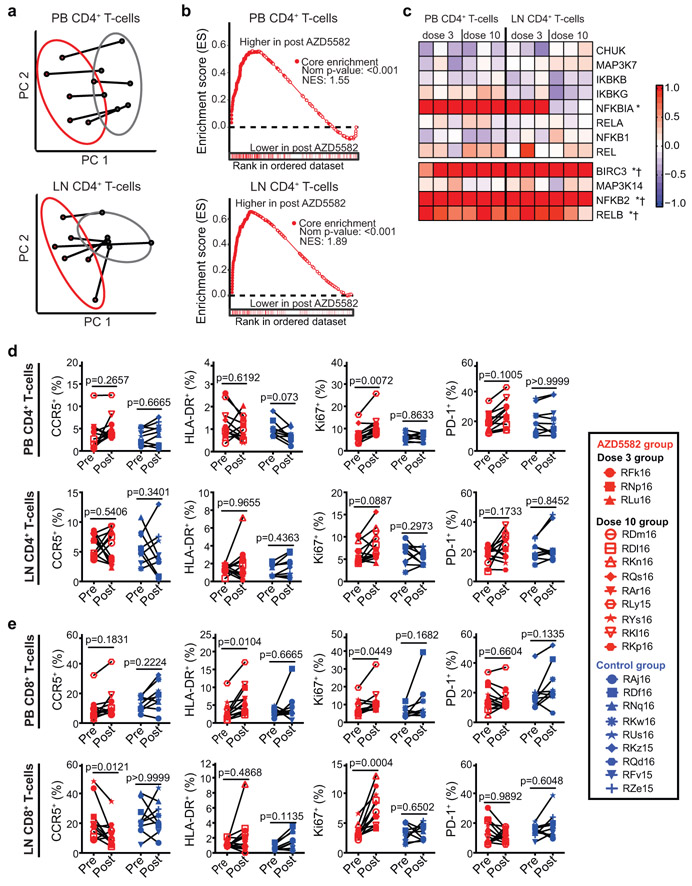
Fig. 4. AZD5582 specifically activates the ncNF-κB pathway in SIV-infected, ART-suppressed RMs without generalized T cell activation.
(a-c) Peripheral blood (PB) and lymph node (LN) CD4+ T cell gene expression in SIV-infected, ART-suppressed RMs pre- and post-AZD5582 treatment (n=6 for both LN and PB; for each, n=3 for 3 doses of AZD5582 and n=3 for 10 doses of AZD5582). (a) PCA plots comparing PB (top) and LN (bottom) CD4+ T cell transcriptomes pre- (gray) and post- (red) AZD5582. Ellipses: two standard deviations. (b) GSEA plots of NF-κB-induced genes in PB (top) and LN (bottom) CD4+ T cells. Gene Set: “HALLMARK TNFα SIGNALING VIA NF-κB” (MSigDB). (c) Heatmap of cNF-κB (top) and ncNF-κB (bottom) pathway gene expression. Color scale: log2-fold changes from pre-treatment. Genes differentially expressed post-AZD5582 in PB (asterisks) or LN (crosses) CD4+ T cells are noted. Expression of activation markers in (d) CD4+ and (e) CD8+ T cells in PB (top) and LN (bottom) of SIV-infected, ART-suppressed RMs pre-AZD5582 and 48 h after the final dose (n=12, red) and control RMs (n=9, blue). Statistical significance was determined with a two-sided Mann-Whitney test.

