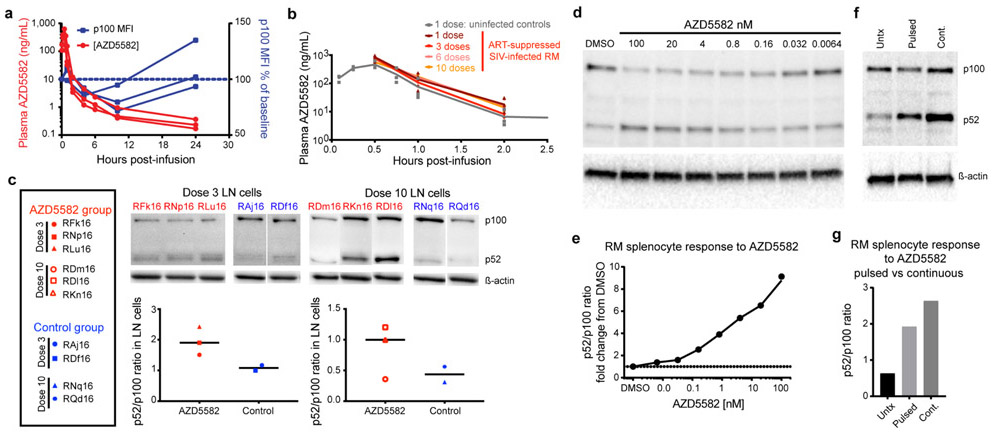
Extended Data Fig. 4. Pharmacokinetic and pharmacodynamic assessment of AZD5582 in RMs.
(a) AZD5582 (0.1 mg/kg) was administered to healthy RMs (n=3) by intravenous infusion. Plasma concentrations of AZD5582 (left Y axis) are shown at the indicated time points. Flow cytometry was used to measure intracellular p100 levels, shown as geometric mean fluorescence intensity (gMFI) in CD4+ T cells and plotted as percentage of baseline p100 gMFI (right Y axis). (b) Plasma concentrations of AZD5582 after 1 (dark red), 3 (red), 6 (pink) or 10 (orange) doses in 6 SIV-infected, ART-treated RMs and after 1 dose in 3 uninfected control RMs (gray). Individual values are shown with symbols. (c) Western blot analyses of inactive p100 and active p52 forms of NF-κB2 in lymph node mononuclear cells collected 48 h after the third or tenth dose of AZD5582 in SIV-infected, ART-suppressed RMs (red; n=3 for both 3 dose and 10 dose groups) or at equivalent time points for placebo controls (blue; n=2 for both 3 dose and 10 dose groups). Immunoblots are shown in the top panels and densitometry analyses of the p52:p100 ratios are shown in the bottom panels. Line represents the median. (d) Cryopreserved control RM splenocytes were treated with the indicated concentration of AZD5582 for 48 h, then p100/p52 levels analyzed by Western blotting to measure engagement of the ncNF-κB pathway. For (d and e): the experiments were performed in duplicate. (e) DMSO-normalized densitometric p52:p100 ratio versus the AZD5582 concentration. (f) Cryopreserved RM splenocytes were exposed to DMSO alone (Untx), 100 nM AZD5582 washed off after 1 h and cultured for 47 h (Pulsed), or continuous 100 nM AZD5582 for 48 h (Cont.) then studied by Western blot for p100 and p52 levels. (g) Densitometric p52:p100 ratio. For (f and g): data represents a single experiment. For gel source data, see Supplementary Figure 1.

