

Abstract
Total internal reflection microscopy combined with microfluidics and supported bilayers is a powerful, single particle tracking (SPT) platform for host-pathogen membrane fusion studies. But one major inadequacy of this platform has been capturing the complexity of the cell membrane, including membrane proteins. Because of this, viruses requiring proteinaceous receptors, or other unknown cellular co-factors, have been precluded from study. Here we describe a general method to integrate proteinaceous receptors and cellular components into supported bilayers for SPT fusion studies. This method is general to any enveloped virus-host cell pair, but demonstrated here for feline coronavirus (FCoV). Supported bilayers are formed from mammalian cell membrane vesicles that express feline aminopeptidase N (the viral receptor) using a cell blebbing technique. SPT is then used to identify fusion intermediates and measure membrane fusion kinetics for FCoV. Overall, the fusion results recapitulate what is observed in vivo, that coronavirus entry requires binding to specific receptors, a low-pH environment, and that membrane fusion is receptor- and protease-dependent. But this method also provides quantitative kinetic rate parameters for intermediate steps in the coronavirus fusion pathway, which to our knowledge have not been obtained before. Moreover, the platform offers versatile, precise control over the sequence of triggers for fusion; these triggers may define the fusion pathway, tissue tropism, and pathogenicity of coronaviruses. Systematically varying these triggers in this platform provides a new route to study how viruses rapidly adapt to other hosts, and to identify factors that led to the emergence of zoonotic viruses, such as human SARS-CoV and the newly emerging human MERS-CoV.
Keywords: Supported lipid bilayers, Membrane fusion, Coronavirus, Fusion kinetics
1. Introduction
Coronaviruses are membrane-enveloped viruses that show a high degree of adaptability for infecting a wide range of host cells and different species. It is not well-understood how these viruses adapt to new hosts, yet they are an increasing concern as a source of emerging viruses for the human population, including SARS-CoV and the newly emerging MERS-CoV [1], [2], [3]. Both SARS-CoV and MERS-CoV produce fatal disease in the majority of people who contract the infection. Quantitative studies of the entry process of the virus are therefore necessary for understanding the cues that mitigate host adaptation and for developing strategies to prevent infection. But accurately establishing the impact of various triggers on membrane fusion requires experimental techniques capable of quantifying fusion kinetics to characterize the fusion intermediates, the kinetic rate constants for transitional steps, and the fusion pathway.
A relatively new approach for quantitatively studying viral entry kinetics is single particle imaging using total internal reflection fluorescence microscopy (TIRFM) [4]. TIRFM requires that a supported lipid bilayer (SLB) containing viral receptors is located within 100 nm of an evanescent wave produced by total internal reflection at the interface between two dissimilar materials. This requirement is easily achieved by coating the walls of a glass microfluidic channel with an SLB. SLBs preserve many properties of the cell membrane, like chemical tunability, lipid diversity, and mobility of its constituents in a planar geometry, but without the experimental complications imposed by live cells. However, a significant limitation of this platform has been capturing the complexity of cell membranes, especially the incorporation of membrane proteins. This limitation has precluded studies of viruses that use proteinaceous receptors (like coronaviruses) to date. As such, these platforms have been limited to the study of a few viruses, such as influenza virus [5], [6], [7], Sindbis virus [8], and vesicular stomatitis virus (VSV) [9], because these viruses have either known glycolipid receptors or are known to interact with specific lipids that are easily incorporated into SLBs. Herein we describe a method to integrate the proteinaceous receptor for feline alphacoronavirus WSU 79-1683 (referred to here as FCoV) into a supported bilayer and measure membrane fusion kinetics using single particle tracking. Importantly, this new method of forming proteinaceous supported bilayers for virus fusion studies opens single particle fusion assays to any enveloped virus that binds to proteinaceous receptors.
To initiate infection, coronaviruses typically engage specific proteinaceous receptors on the surface of host cells. The specificity of receptor binding is believed to be one of the key factors in the host range of a given coronavirus [10]. One of the best-characterized receptors is aminopeptidase N (APN), which is utilized by the majority of coronaviruses in the alphacoronavirus genus [11], [12], [13]. Baby hamster kidney (BHK) cells are transfected with the feline aminopeptidase N (fAPN) and encapsulated into vesicles using a cell blebbing technique [14], [15], [16], [17], [18]. These vesicles are then used to form proteinaceous supported bilayers to which coronavirus can fuse and be observed at the single particle level using TIRF microscopy. This method for creating proteoliposomes is in contrast to the usual approach to incorporate membrane proteins into vesicles, where proteins are reconstituted into proteoliposomes using detergent. Detergents solubilize the proteins out of the cell membrane and can result in loss of native conformation of the proteins. For pathogenesis, the conformation of proteins in the membrane and its glycosylation are critical to controlling the host-pathogen interaction. We show here that fAPN in the supported bilayer made from blebs is enzymatically active, oriented properly, and competent to bind FCoV prior to membrane fusion.
Feline coronavirus was chosen for this work because it has a well-characterized receptor (APN), grows readily in cell culture, and is not infectious in humans. FCoV, therefore, serves as a safe and effective model virus to demonstrate the use of the single particle approach to characterize membrane fusion of a virus requiring a proteinaceous receptor.
1.1. Membrane-enveloped virus entry via class I fusion proteins
Like influenza virus, many coronaviruses can use the endocytic pathway to enter cells [19]. Once inside the endosome, the challenge for viruses is delivering their genetic material across the membrane and into the cytosol for viral replication. All enveloped viruses have membrane proteins that facilitate the fusion of their lipid envelope with the host cell membrane [20]. Coronavirus particles possess at their surface the spike (S) envelope glycoprotein, which is a class I fusion protein [21]. Whereas the structure and function of the prototypical class I fusion protein, influenza virus hemagglutinin (HA), is well understood, structure–function relationships for coronavirus S proteins are not well characterized. For coronaviruses, the S protein mediates virus entry and determines cell tropism and pathogenesis [22]. Like influenza virus HA, the coronavirus S protein has two primary functions: 1) it controls the binding of the virus to a cell membrane receptor, and 2) it mediates membrane fusion between the viral and host membranes [20]. In general, receptor binding is controlled by the S1 domain of the protein, while membrane fusion is mediated by the S2 domain. A conformational change in the S2 domain is believed to drive the viral membrane to fuse with the host membrane. For most coronaviruses, this conformational change is triggered by the acidification of the endosome, although pH-independent fusion can also be observed.
It is generally believed that all class I fusion proteins follow a common fusion pathway that has been well-established in the prototypical class I influenza virus. Class I fusion proteins go through a multi-step process to achieve a fusion pore that begins with a fusion protein conformational change triggered by low pH. During the conformational change the fusion protein unfolds and thrusts the fusion peptide into the hydrophobic region of the host membrane. Next, the protein folds back, bringing the anchored membrane in close contact with the viral membrane until a stalk-like structure is formed. The stalk structure results from the mixing of the outer leaflet of the host membrane with the viral membrane, referred to as hemifusion. After a short lag time, the stalk is converted into a fusion pore through which the viral contents can exit. It may be necessary for multiple fusion proteins to work in concert to bend the membrane to induce fusion.
Analogous to influenza HA, it is believed that the coronavirus S protein, undergoes proteolytic cleavage prior to fusion activation [22]. Proteolytic cleavage is believed to expose specific regions of the S protein, including the fusion peptide [23]. Because proteolytic cleavage dictates fusion competency, the availability of proteases in the extracellular milieu is another key factor in tropism of coronavirus. A dramatic example of this is human SARS-CoV. The bound virus is able to fuse at the cell surface in absence of acidic pH, when exposed to exogenous proteases [24]. This route of entry may even be 2 to 3 orders of magnitude more efficient that the endosomal pathway [24]. In this case, proteolytic cleavage changed the fusion pathway. By combining single particle fusion with proteinaceous supported bilayers and microfluidics, the sequence of triggers can be controlled and the associated fusion pathway and kinetics quantitatively measured.
2. Materials and methods
2.1. Cells, plasmids, and viruses
Baby hamster kidney-21 (BHK-21) cells, obtained from the American Type Culture Collection (ATCC, Manassas, VA), were grown and maintained in Dulbecco's modified Eagle medium (DMEM, CellGro) supplemented with 10% fetal bovine serum (Gibco), 100 U/ml penicillin and 10 μg/ml streptomycin (CellGro), 1% HEPES buffer (CellGro) in a 37 °C, 5% CO2 incubator. The pcDNA-fAPN and pCI-neo-hAPN plasmids were used for transfections of BHK-21 cells. They encode the feline aminopeptidase N (fAPN) and human aminopeptidase N (hAPN), respectively, and are generous donations from Kathryn Holmes of the University of Colorado. pCAGGS-FCoV-1683 S plasmid encodes the S protein of FCoV-1683 [25]. The pCAGGS vector was used as an empty vector control.
Feline Coronavirus (FCoV) strain WSU 79-1683, also referred to FCoV-1683, was obtained from the Cornell Animal Health Diagnostic Center (Cornell University, Ithaca, NY). The virus was grown in canine A-72 cells provided by Dr. Colin Parish (Baker Institute of Animal Health, Cornell University, Ithaca, NY).
2.2. Preparation of cell blebs
The formation of cell blebs was established in the mid-1970's [14]. An excellent review of cell blebbing protocols is available in Ref. [17]. Here, we use a blebbing procedure published previously by our group [18]. For transfections, 1.5 × 10⁶ cells were seeded in 10 cm culture dishes, and incubated for 24 h. Transfections were performed using TurboFect transfection reagent (ThermoScientific) according to manufacturer's instructions and using 6 μg of plasmid DNA for each plate. Twenty-four hours after transfection, cells were washed twice with buffer A (2 mm CaCl2, 10 mm HEPES, 150 mm NaCl at pH 7.4). 3 ml of buffer B (2 mm CaCl2, 10 mm HEPES, 25 mm formaldehyde, 2 mm dithiothreitol (DTT) and 150 mm NaCl at pH 7.4) was added to each dish to induce cell blebbing. The dishes were then incubated for 1 h at 37 °C with gentle rocking. After incubation, the cell supernatant, containing detached cell blebs, was decanted into a 15 ml falcon tube and placed on ice for 20 min to allow any detached cells to settle out. The supernatant was transferred to new test tube. Blebs were then dialysed using cellulose dialysis tubing (Fischer Scientific), in two 100 ml volumes of buffer A for 24 h. The size of cell blebs was determined by dynamic light scattering using a Malvern Zetasizer Nano (Worcestershire, UK). The sample registered 3 peaks at approximately 38 nm, 106 nm, and 530 nm.
2.3. Preparation of liposomes
The following lipids/materials were used in the experiments: 1-oleoyl-2-palmitoyl-sn-glycero-3-phosphocholine (POPC), 1-oleoyl-2-palmitoyl-sn-glycero-3-phosphoethanolamine (POPE), 1,2-dioleoyl-sn-glycero-3-phosphocholine (DOPC), cholesterol, and sphingomyelin. These materials were all purchased from Avanti Polar Lipids (Alabaster, AL). Oregon green DHPE purchased from Molecular Probes (Eugene, OR) was used to label supported bilayers and as a pH sensor to mark acidification of the bilayer during membrane fusion experiments. Octadecyl Rhodamine (R18), a red-emitting, lipophilic fluorophore, was used to label cell bleb membranes and was purchased from Molecular Probes. We also synthesized in house a green-emitting, lipophilic fluorophore, Rhodamine 110 Octadecyl ester (R110C18), from Rhodamine 110 Chloride and 1-octadecanol purchased from Sigma–Aldrich. The synthesis procedure has been published previously [7]. R110C18 was used to label viral membranes during dual-labeling virus fusion experiments. Sulforhodamine B (SRB), a red-emitting, water-soluble fluorophore purchased from Molecular Probes was used to label virus interiors.
The liposome formulation used in these studies (BHK-liposome) contained POPC, POPE, sphingomyelin and cholesterol in the ratio 37.3:34.2:5.7:22.8. This composition was formulated to match the native lipid content of BHK cells as closely as possible [26] and primarily used in the formation of bleb-derived supported bilayers.
To form liposomes, appropriate amounts of each component were mixed in biotechnology grade chloroform in a scintillation vial. For formulations containing sphingomyelin, this component was first dissolved in a 4:1 mixture of chloroform:methanol then added to the mixture. The bulk solvent was removed from the vial under a stream of high purity nitrogen gas and then placed in a desiccator under vacuum overnight to ensure complete evaporation of all solvent. Phosphate-buffered saline at pH 7.4 was added to the dried lipid film and gently re-suspended in a sonication bath (Model # BD2500A-DTH; VWR) for 20 min on the lowest setting. The final lipid concentration was approximately 2 mg/ml. Liposomes were then extruded twice through a polycarbonate filter (Whatman Nucleopore) with pore size 100 nm, and five times through a filter with a pore size of 50 nm. The average liposome diameter for all formulations ranged between 90 and 100 nm as determined by dynamic light scattering.
2.4. Fluorescent labeling of cell blebs or viruses
To visualize both the formation of the fAPN-bleb supported bilayer formation and viral membrane fusion, blebs and viruses were fluorescently labeled. To visualize fusion using a fluorescence dequenching technique, viral membranes must be labeled with a semi-quenched amount of fluorophores following standard procedures [27], [28]. In these experiments, FCoV was labeled with R110C18 according to the following general procedure.
2.4.1. General membrane labeling procedure (single color)
To fluorescently label the bleb membranes for the visualization of bilayer formation and photobleaching experiments (FRAP), blebs were incubated with 1 μl 0.18 mm R18, dissolved in ethanol, for 15 min in a sonicating bath (VWR) on the lowest setting.
To fluorescently label FCoV membranes for fusion experiments, R110C18, dissolved in ethanol, was used. 5 μl of virus solution was diluted with 250 μl of buffer A and mixed with 3 μl of 2 mm R110C18 for 1 h in a sonicating bath. In this case, it is desired to label membranes with a quenched amount of R110C18 to trigger dequenching during membrane fusion. Free R110C18, which did not insert into the membranes, was removed from the solution by centrifuging (Eppendorf, Centrifuge 5451C, Hauppauge, NY) through a G-25 spin column for 2 min at rate of 3 × 1000 min−1. The supernatant containing the purified virus was diluted with 0.8 ml of buffer A and gently vortexed to mix.
2.4.2. General virus interior labeling procedure
For pore formation experiments, 5 μl of virus solution was mixed with 10 μl of 20 mm Sulforhodamine B (SRB) solution and incubated overnight. Excess SRB, which did not partition into the virus interior, was removed from the solution by centrifuging through a using a G-25 spin column for 2 min at rate of 3 × 1000 min−1. The supernatant was diluted in 0.8 ml of buffer A prior to use.
2.4.3. Feline coronavirus dual-color labeling
For FCoV hemifusion experiments, it was necessary to label the membrane with a green fluorophore to distinguish it from the red internal flouorophore label. For these experiments, virus that had been labeled with SRB as described in the previous section, was labeled with 3 μl of R110C18 (2 mm). The mixture was sonicated gently for 1 h and excess dye was removed as previously described using at G-25 spin column.
2.5. Preparation of microfluidic devices and PDMS wells
2.5.1. Preparation of glass surfaces for supported bilayers
Glass microscope coverslips (25 mm × 25 mm; No. 1.5) from VWR were cleaned in piranha solution consisting of 70% sulfuric acid and 30% hydrogen peroxide. Slides were immersed in 150 ml of piranha solution for 10 min then rinsed for 30 min with copious amounts of deionized water with a minimum resistance of 18.2 MΩ cm obtained from a Siemens Purelab Ultra water purification system. Clean slides were stored under deionized water and dried with a stream of ultra-pure nitrogen gas prior to use. For bilayer formation, glass surfaces were used either with PDMS wells or microfluidic devices.
2.5.2. Fabrication of polydimethylsiloxane (PDMS) wells
To form the PDMS wells, a thin sheet of PDMS was made in a Petri dish using 10:1 elastomer/crosslinker mixture of Sylgard 184 (Robert McKeown Company; Branchburg, NJ). The PDMS was baked for 3 h at 80 °C, cut into small squares approximately the same size as a coverslip, and a hole punched through each square to form the wells. PDMS squares were then attached to a clean glass coverslips, which formed the bottom of the wells. The approximate volume of a well was 100 μl.
2.5.3. Fabrication of microfluidic devices
Microfluidic devices for the fusion experiments were fabricated using soft lithography. The microchannel pattern was designed using the CAD software program L-Edit (Tanner EDA) and a master of the flow pattern was made on a silicon wafer at Cornell Nanoscale Science and Technology Facility (CNF). Each microfluidic device contained six channels. The dimensions of each channel are 1 mm wide by 70 μm deep with a total length of the channel of 1.5 cm. The spacing between the centers of each channel is 1 mm. The silicon wafer was coated with P-20 primer in a spin coater, followed by SPR220 (Megaposit) photo-resist. The wafer was baked for 90 s at 115 °C and then exposed to UV light for 7.5 s in an ABM contact aligner to pattern the wafer with the flow cell design. Following this step, the wafer was baked again for 90 s at 115 °C and then developed for 60 s in a Hamatech-Steag Wafer Processor. The pattern was then etched into the wafer using an Unaxis 770 Deep Si Etcher. The depth of the channel was determined using a Tencor P10 Profilometer.
Microfluidic devices were formed using PDMS in a molding process. To facilitate the release of the cured PDMS after molding on the etched silicon master, the master slide was first coated with Sigmacote (Sigma). A 10:1 (elastomer/crosslinker) mixture of Sylgard 184 was mixed and then degassed before pouring on the silicon master slide etched with the flow cell pattern. The PDMS was then baked for 3 h at 80 °C. After baking, PDMS microfluidic devices were peeled off of the wafer, and inlet and exit ports were punched in each channel of the device. Both the clean glass coverslip and PDMS mold were treated with oxygen plasma using a Harrick Plasma Cleaner (Model # PDC-32G; Ithaca, NY) at a pressure of 750 μm on the high setting for 25 s. Gently pressing the surfaces together resulted in a tight bond between the glass and PDMS and formed the four walls of the microfluidic channel.
2.6. Creating supported bilayers in microfluidic channel
A solution containing a 1:4 dilution fAPN-blebs in buffer A was drawn into the microchannel at a flow rate of 30 μl/min for 1 min and incubated on the glass surface for 20 min. The microchannel was then rinsed with buffer A at 100 μl/min for 2 min. A solution of BHK-liposomes (0.5 mg/ml) was drawn into the microchannel at 100 μl/min for 1 min and incubated for 10 min. To heal any defects in the membrane, more vesicle solution was drawn into the microchannel at 10 μl/min for 5 min. Finally, the microchannel was rinsed with buffer A at 100 μl/min for 2 min to remove any excess liposomes.
2.7. Diffusion measurements in supported bilayers
Integrity of bilayers and diffusion of the lipids within it was examined by fluorescence recovery after photobleaching (FRAP). Bilayers were formed following the above procedures inside PDMS wells. R18 was used to label the bilayer and carry out the photobleaching experiments. Once formed, bilayers were gently scratched with a dissection tool to remove a thin section to aid in focusing on the plane of the bilayer on the microscope. Following this step, the bilayer was rinsed again for 1 min with buffer A to wash out any lipids removed by scratching. A 20 μm diameter spot in the supported lipid bilayer was bleached with a 4.7 mW 488 nm krypton/argon laser for 200 ms. The recovery of the intensity of the photobleached spot was recorded for 15 min at regular intervals. The fluorescence intensity of the bleached spot was determined after background subtraction and normalization for each image. The recovery data was fit using a Bessel function following the method of Soumpasis [29]. The diffusion coefficient is then calculated using the following equation: , where w is the full width at half-maximum of the Gaussian profile of the focused beam.
For protein mobility, single particle tracking at 100× magnification was conducted. Fluorescently labeled fAPN-specific antibodies (see next section for antibody and labeling details) were bound to fAPN in the bilayer and monitored for at least 40 min to determine if any proteins diffused during that time. Fig. S3 summarizes the protein mobility results.
2.8. Antibody binding to confirm presence and orientation of APN in the supported bilayer
To confirm that fAPN proteins were incorporated into the supported bilayer and the active, extracellular end was oriented facing the bulk solution (i.e., not inverted towards the glass support), the bilayer was incubated with an fAPN-specific antibody, RG4 [30] (generously donated by Tsutomu Hohdatsu), which recognizes an epitope (residues 251–582) [12] located in the C-terminal ectodomain (extracellular-facing domain) of the protein. The bilayer was incubated with 1 μg/ml of a primary antibody anti-fAPN mouse monoclonal antibody (RG4) for 20 min. The unbound primary antibody was rinsed and 1 μg/ml of Alexa Fluor 488 conjugated-goat anti-mouse IgG secondary antibody was added and incubated for 20 min. Excess secondary antibody was rinsed and the sample was imaged on an inverted fluorescence microscope with appropriate filter set, described below.
2.9. Functionality of APN in cell blebs and supported bilayers (APN enzyme activity assay)
Many cells and species express aminopeptidase N. APN is a membrane-bound enzyme that cleaves the N-terminal amino acids from bioactive proteins, leading to their inactivation or degradation [31]. This function is believed to be integral to several biological processes including antigen processing and presentation, cell adhesion, tumor cell metastasis, neurotransmitter degradation. APN also serves as a well-characterized receptor for certain coronaviruses [32], including FCoV-1683 [12] used in these experiments.
To ensure the APN proteins maintain their native enzymatic functionality in the supported bilayers, we performed an enzymatic activity assay. In this assay, the substrate for APN is non-fluorescent until the enzyme cleaves it. Therefore, functionality of APN in blebs or supported bilayers can be verified by detecting fluorescence after introducing the substrate into a cuvette of bleb solution or into a microfluidic device containing supported bilayers. For these experiments, human APN (hAPN), instead of feline APN, was expressed in BHK cells and tested for activity. This change was necessary because there is no activity assay specific for the feline APN. The control cases are the empty vector blebs or empty vector-SB.
2.9.1. Blebs in solution
Blebs containing human APN (hAPN) were formed as previously described for fAPN-blebs. The activity of hAPN and empty vector cell blebs in solution was tested using bulk fluorescence measurements in fluorometer (Photon Technologies International Inc) at an excitation/emission of 380/460 nm. The substrate for hAPN, H-Ala-AMC, was purchased from Bachem. A 50:50 mixture of blebs and H-Ala-AMC substrate at 270 μm in a 50 mm Tris buffer at pH 7.4 were mixed in a quartz cuvette and intensity of the mixture was monitored for 30 min.
2.9.2. Supported lipid bilayer
Bleb-derived supported bilayers containing hAPN were formed in microfluidic channels as previously described for fAPN-SBs. The substrate, at concentration of 270 μm in 50 mm Tris buffer at pH 7.4, was drawn into the channel at a flow rate of 100 μl/min for 2 min. The fluorescence intensity of the channel was observed at 10× magnification at an excitation/emission of 380/455 nm. A control channel containing an empty vector bleb-derived supported bilayer devoid of exogenous APN proteins was subjected to the same conditions as described above.
Fig. S5 summarizes the enzyme activity assay results. In Fig. S5a, blebs with and without hAPN were loaded into cuvettes and the fluorescence monitored temporally using a fluorometer after the substrate was added. The empty vector blebs show no appreciable fluorescence, while the hAPN blebs continue to increase in signal as increasing amount of substrate is cleaved during the course of the experiment. In Fig. S5b, supported bilayers with and without hAPN are loaded into a microfluidic channels with substrate. The microfluidic device is monitored at specific time points and the two channels are compared in the inset. In the control case, no fluorescence is detected above the background, but the hAPN-SB shows significant intensity after several hours.
2.10. Cleavage of FCoV spike protein by trypsin protease (Western blot)
In order for class I fusion proteins to become fusion-competent, they must first be activated by proteolytic cleavage, a modification performed by cellular proteases. There are numerous enzymes capable of proteolytically cleaving the coronavirus spike protein. These proteases can be found in either the intra- or extra-cellular environment. For example, cathepsin proteases found in the endosomal compartment are naturally used to breakdown proteins taken up into the lysosome [33]. Once a virus gets endocytosed, cathepsins can also cleave the coronavirus spike protein [25], [34], [35], [36], [37]. Trypsin is a common extracellular protease found in the digestive tract of many vertebrates [38] to break down proteins during digestion [38]. We show here that trypsin is also capable of cleaving the spike protein of coronaviruses.
Cleavage likely occurs at two distinct sites for coronavirus S: at the junction of the S1/S2 domains, as well as within the S2 domain (S2′) [39]. Proteolytic cleavage is believed to expose specific regions of the S protein, including the fusion peptide [23]. For some coronaviruses, cleavage at S1/S2 is necessary to allow subsequent cleavage at S2′, and allow the S2 domain to respond a low pH trigger that initiates the conformational change required for fusion [39]. In other coronaviruses, in particular alphacoronaviruses, like FCoV-1683, the S1/S2 site does not need to be cleaved. In these cases, activation is likely mediated solely through the S2′ cleavage site.
We used trypsin as a means to activate FCoV-1683 S. To confirm that trypsin can proteolytically cleave FCoV-1683 S in an appropriate manner, FCoV-1683 viral suspensions were ultracentrifuged at 42,000 rpm in a TLA 55 rotor using an Optima Max-E ultracentrifuge (Beckman Coulter) for 2 h at 4 °C. The viral pellets were resuspended in 50 μl of PBS (non-treated sample), or PBS containing 3 μg/ml of l-1-Tosylamide-2-phenylethyl chloromethyl ketone (TPCK)-treated trypsin (ThermoScientific) (trypsin treatment), or MES buffer pH 5.0 supplemented with 2.5 mm EDTA and 2 mm DTT and containing 0.5 μM Cathepsin B (Calbiochem). The samples were incubated at 37 °C for 1 h, except the cathepsin-treated sample which was incubated for 15 min at 37 °C. All samples were then subjected to treatment with the deglycosylating enzyme PNGase F (New England Biolabs), using 2500 units and supplied buffer at 37 °C for 16 h. This was done to avoid having differentially glycosylated species of S protein. LDS loading buffer (Invitrogen) with DTT (50 mm final) was added to samples, and were subjected to 5 min 95 °C incubation for denaturation. The samples were then analyzed by Western blot using FCoV-S-specific mouse mAb 22G6.4, provided by Dr. Ed Dubovi (Animal Health Diagnostic Center, New York State College of Veterinary Medicine, Cornell University) followed by incubation with HRP-conjugated goat anti-mouse IgG (AbCam).
As shown in Fig. S6, cathepsin B and trypsin treatment yield major cleavage products at approximately 100 kDa, while in the non-treated sample, the majority of S protein migrated as a single band around 200 kDa, indicating little cleavage event occurred without protease treatment. These results show that trypsin cleaves FCoV 1683 S in a similar way as does cathepsin B, and are consistent with published results for this virus cleaved with cathepsin B [25].
2.11. TIRF microscope configuration
Membrane fusion assays were conducted with total internal reflection fluorescence (TIRF) microscopy using an inverted Zeiss Axio Observer.Z1 with a α Plan-Apochromat 100× oil objective with a numerical aperture (NA) of 1.46. Index-matching liquid (Carl Zeiss, Inc.) was used to couple the glass coverslip of the microfluidic device to the objective. In this setup, two lasers can be used simultaneously to excite different color fluorophores; we used 561 nm and 488 nm excitation wavelengths from solid-state lasers. These were coupled into the optical pathway of the microscope using a Laser TIRF 3 slider (Carl Zeiss, Inc.), which controlled the angles of incidence. Exceeding the critical angle for glass/water interface (∼62°) ensured total internal reflection of the lasers and created evanescent waves about 100 nm thick. At this thickness, the evanescent waves excited fluorophores positioned within the supported bilayer, or virions labeled R18. The excitation laser light was band-pass filtered through a Semrock 74 HE GFP/mRFP filter cube, and then combined with a dichroic mirror before being focused on the outer edge of the back aperture of the objective. The fluorescence emission signal was filtered through a 525/31 and 616/57 nm dual band-pass emission filter and then sent to an electron multiplying CCD camera (Hamamatsu ImageEM C9100-13, Bridgewater, NJ).
2.12. Data analysis
2.12.1. Image processing
The images acquired during the membrane fusion assays were analyzed using both ImageJ (NIH) and MATLAB (Mathworks). Fusing particles were manually selected in ImageJ and the fluorescence intensity in a 4 × 4 pixel region around each particle was collected as a function of time. In videos where background noise was high due to a large amount of fusion events, a rolling ball background subtraction algorithm was applied to all of the images to remove excess background noise as the fluorophores diffused into the membrane after hemifusion. The rolling ball algorithm determines the local background for every pixel by averaging over a large circular region around the pixel. This background value is then subtracted from the original image. The fluorescence trajectories for the particles were then imported to MATLAB (Mathworks) for further analysis. A code written in MATLAB determined the onset time of the dequenching ‘spike’ for each particle by finding the time of the maximum intensity in each particle trajectory.
Supplementary data related to this article can be found online at http://dx.doi.org/10.1016/j.biomaterials.2013.06.034.
The following are the Supplementary data related to this article:
2.12.2. Statistical accuracy of fusion kinetics
The accuracy with which N and k H can be determined depends on both the number of experimental observations and the number of steps in the process [40]. To accurately estimate N from a gamma distribution a minimum number of a fusion events must occur for statistical significance. For example, to distinguish a 2-step process from a 3-step process i.e., N = 2 from N = 3, a minimum of 50 fusion events must be observed [40]. The number of fusion events that occurred during each experiment reported here varied from 70 to 120.
3. Results and discussion
3.1. Proteinaceous supported bilayer formation from cell blebs expressing APN protein
Pure liposome solutions, prepared as described in the Methods section, self-assemble on glass to form supported bilayers via vesicle fusion [41], [42]. Proteoliposomes, on the other hand, generally do not readily form supported bilayers on their own. We discovered that proteoliposomes derived from cell blebs could be induced to form supported bilayers with the addition of pure liposomes [18]. We describe this self-assembly process here in the context of forming fAPN-supported bilayers (fAPN-SB) as substrates for FCoV fusion studies. The process is illustrated in Fig. 1 (top) and begins with the formation of cell blebs containing fAPN. The detailed procedure for forming cell blebs containing fAPN from BHK cells can be found in the Methods section. fAPN blebs are then used to form proteinaceous supported bilayers, as will be described in detail next. Once the proteinaceous supported bilayer is formed, FCoV binds to fAPN, localizing the virus within the evanescent wave and enabling single particle fusion experiments that will be described in a later section.
Fig. 1.

(Top) Illustration of the formation of a fAPN-bleb supported bilayer from cell blebs derived from BHK cells. (Bottom) Fluorescence images of fAPN-SB formation, corresponding to the above cartoon. (Left, t = 0) fAPN-blebs containing R18 adsorbed to glass substrate. Note that some larger blebs dominate the signal, but many smaller blebs are adsorbed as well. (Middle images) ∼100 s after the addition of BHK-liposome solution to adsorbed blebs. Note that the BHK-liposome solution is devoid of fluorescent label, thus all signal comes from release of R18 initially confined to the bleb vesicle before rupture. (Right, t = 300 s) Continuous supported bilayer observed 300 s after the addition of liposomes. These images are all taken under 40× magnification. The dark lines in each image are scratches intentionally made with a dissection tool that is used to find the focal plane of the bilayer. The continuous focus of this line throughout the rupture process indicates that the focal plane not change and that the uniform distribution of fluorescence at t = 300 s is due to mobility of fluorophores redistributed throughout the newly-formed planar bilayer.
To visualize the formation of the supported bilayer from fAPN-blebs derived from BHK cells, the bleb membranes were labeled with a lipophilic fluorophore, Octadecyl Rhodamine (R18) (see Methods section). A small aliquot of the labeled bleb solution was added to a PDMS well and incubated for 10 min at room temperature. During this time, blebs contact and adsorb to the glass surface. Excess blebs that did not adsorb to the glass surface were removed by gently rinsing the well with buffer A (2 mm CaCl2, 10 mm HEPES, 150 mm NaCl at pH 7.4). At this stage, the adsorbed intact blebs stick to the glass surface as intact proteoliposomes, as seen in Fig. 1, t = 0 image, as punctuate spots.
To induce the formation of a supported bilayer from the adsorbed blebs, we formulated liposomes to match closely the BHK endosomal membrane composition [26] (referred to as BHK-liposome) and added this solution to the PDMS well containing the adsorbed blebs. In this experiment, the BHK-liposomes are devoid of fluorophore labels. This labeling scheme assists in observing the formation of the supported bilayer as the initially punctuate blebs rupture and the R18 disperses throughout the newly-formed planar bilayer (Fig. 1, bottom image series). Note that as the R18 spreads in the bilayer and gets diluted with the unlabeled BHK lipids, the fluorescence signal increases due to fluorophore dequenching.
Bilayer formation is verified by fluorescence recovery after photobleaching (FRAP). In this technique, a laser beam is used to photobleach a 20 μm diameter spot in the newly-formed fluorescently-labeled (R18) supported bilayer. The recovery of the fluorescence in this photobleached area is used to determine the 2D mobility of R18 embedded in the planar supported bilayer, which in turn, verifies that the R18 is no longer confined to discrete bleb vesicles adsorbed to the glass surface, but freely moving throughout a 2D bilayer plane. FRAP interrogates a macroscale area (∼microns) and thus is useful for characterizing how well the bilayer has formed over this length scale. Note that the largest population of blebs is on the order of 500 nm in diameter (Fig. S1), so if the blebs have not ruptured into a contiguous planar bilayer, then the fluorescence will not be able to recover after the sample is photobleached. This lack of recovery was confirmed by preparing samples containing only adsorbed cell blebs (no addition of BHK-liposomes). Photobleached spots did not recover on these samples.
For mobile samples, we obtain two quantitative measurements from these experiments: the mobile fraction and the 2D diffusion coefficient. Samples were prepared on glass surfaces in PDMS wells, as described above. Fig. 2 is a typical fluorescence recovery of R18 in a fAPN-SBs. From this plot, the recovery is nearly restored to 100%, indicating that the mobile fraction of R18 in the fAPN-SB is quite high. The reported diffusion coefficient, averaged over several, similarly-prepared samples, is 0.35 ± 0.005 μm2/s. Mobile fraction and diffusion coefficient values compare well with a control bilayer made of only R18-labeled BHK-liposomes (see Supplementary Information for data, Fig. S2).
Fig. 2.

fAPN supported bilayer characterization and mobility. R18 fluorescence recovery after photobleaching in a fAPN supported bilayer (similar to t = 300 s in Fig. 1). The images correspond to the times for each color-coded arrow on the plot. The data are fit to curve (black line) to obtain the diffusion coefficient. At t = 0, the bilayer was bleached with a 561 nm laser beam. The diameter of the bleached area is ∼20 μm. The reported diffusion coefficient on the plots is averaged from several experiments. (For interpretation of the references to color in this figure legend, the reader is referred to the web version of this article.)
Note that the recovery curve is smooth and fits well to the 2D diffusion model (black line). Irregular recovery could indicate either disconnected, isolated, bilayer patches that did not heal to form a contiguous film over this length scale, or the presence of lipid microdomain formation. This data indicates that the bilayer has a relatively uniform distribution and is contiguous. Other possibilities for the structure of the bilayer include partial bleb rupture (such as only the outer leaflet fusing to the BHK-liposomes). However, because the diffusion coefficients and mobile fractions in the pure BHK-liposome SLB and fAPN-SB bilayers are comparable, this structure can be ruled out by the following argument. If the blebs were only partially fused, then the R18 trapped in the inner leaflet could not readily exchange with the surrounding lipids after being photobleached. This behavior would manifest as a slower recovery and reduced mobile fraction, relative to the pure BHK-liposome case, over the same timescale of recovery experiment.
Once the bilayer was formed, we verified that the fAPN proteins were incorporated into the supported bilayer and the active, extracellular end was oriented facing the bulk solution (i.e., not inverted towards the glass support) by labeling with a fAPN-specific antibody against the extracellular portion of the protein. Details of these experiments and controls are provided in the Methods section (Fig. S4) and confirm that fAPN is in the bilayer and oriented properly. Next, we tested APN activity in the blebs and support bilayers using an enzyme activity assay (see Methods section). Fig. S5 summarizes the enzyme activity assay, and the results show that APN is enzymatically active in the supported bilayer derived from cell blebs.
Taken together, the antibody binding assay and the enzymatic assay results corroborate that APN protein is functional and maintains its native activity and orientation in the supported bilayer. We note that while the R18 and lipids are mobile in the fAPN-SB (Fig. 2), the proteins do not appear to be mobile to the same extent (Fig. S3). Because APN is the binding receptor for the virus, immobility will reduce the strength of binding (avidity) of the virus to the supported bilayer. However, as long as one receptor bond in able to hold the virus in close proximity to the supported bilayer (and within the evanescent field) prior to fusion initiation, we can still track individual virus fusion events using TIRFM, as will be shown in the next section.
3.2. Coronavirus binding to fAPN-SBs
We coated microfluidic channels with supported bilayers devoid of, or containing, fAPN. To make the bilayers, either empty-vector blebs or fAPN blebs were used, following the procedure described above for PDMS wells, but modified slightly to be compatible with a microfluidic device. A description of this procedure is in the Methods section.
We prepared two suspensions of FCoV virus. The first was treated with the protease, trypsin, (2.5 μg/ml) for 15 min at 37 °C prior to fluorescence labeling, and the second suspension was left untreated. Fig. S6 demonstrates, by Western blot analysis, that trypsin treatment of FCoV-1683 virions results in proper cleavage activation of the S protein. This cleavage step is necessary to prime the S protein for the fusion assay that will be carried out following virus binding.
Next, suspensions of fluorescently-labeled, trypsin-treated FCoV were sent through the channels and incubated for 20 min. During this time, virus bound to the fAPN in the supported bilayer, but virus introduced to the channels containing empty-vector-SBs showed no visible binding (Fig. 3 ). Comparing these results emphasizes the requirement that the supported bilayer contain fAPN to localize the virus at the bilayer surface.
Fig. 3.

A comparison of FCoV binding to (top) empty vector-SB and (bottom) fAPN-SB. The fAPN-SB exhibits specific binding of the virus. Note that due to the random intercalation of R18 in the viral membranes, fluorescence quenching varies among the virions, so some viruses are dimmer than others in this image.
3.3. pH-triggered fusion
To monitor and distinguish the intermediate steps in the fusion pathway from each other in the single particle fusion assay, we use a dual-color labeling scheme (Fig. 4 ), as described in the Methods section. Here, the viral membrane is labeled with a green-emitting, lipophilic fluorophore (R110C18), and the internal contents are labeled with a red-emitting fluorophore (SRB). With this scheme, hemifusion of the outer leaflets is marked by fluorescence dequenching of R110C18 when the outer leaflets mix. Pore formation is marked by a drop in SRB fluorescence at the fusion site, indicating release of the internal contents. These colors are co-localized in one particle by simultaneous monitoring of both emission wavelengths using TIRFM. In this way, three important time intervals can be obtained for each individual particle: 1) the time for the onset of hemifusion; 2) the lag time between hemifusion and pore formation; and 3) the time when the internal contents is released.
Fig. 4.
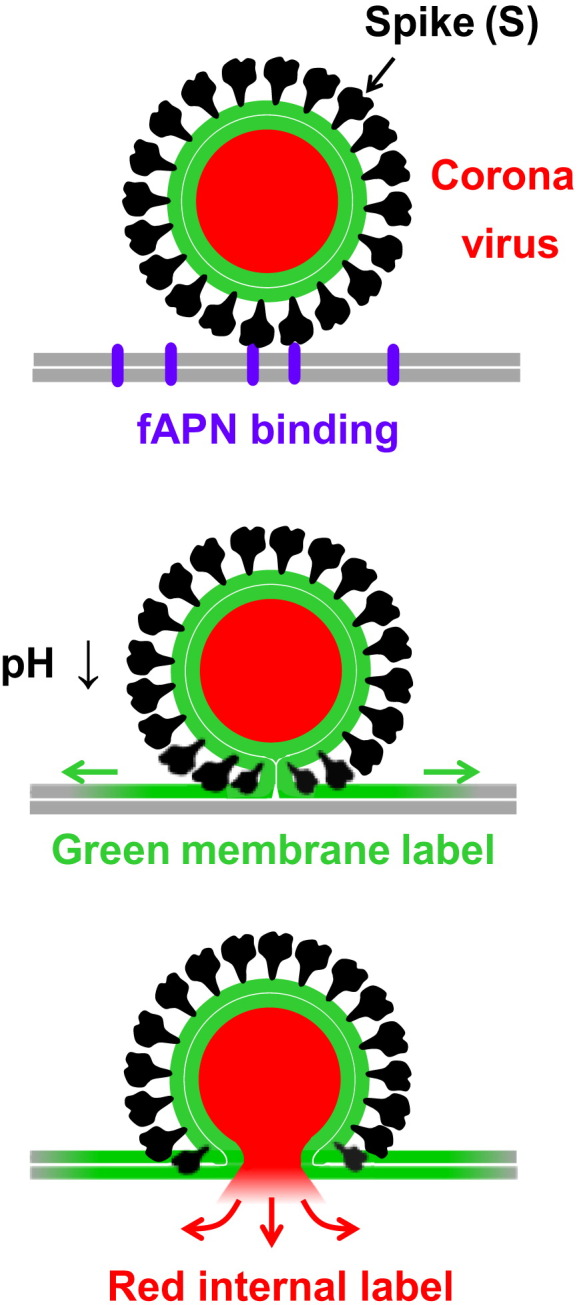
Dual-labeling scheme of coronavirus for single particle fusion experiments that facilitate the capture of intermediate states. The viral membrane is labeled with a green-emitting, lipophilic fluorophore. The viral contents are labeled with a red-emitting fluorophore. The two leaflets of the membranes are distinguished by the thin white line. (top) Spike proteins bind to fAPN (purple) present in the supported bilayer (gray). (middle) A drop in pH triggers hemifusion between the viral membrane and supported bilayer, leading to the mixing of the outer leaflets of each and the formation of a stalk. (bottom) Collapse of the stalk into a fusion pore, which results in the release of viral contents. (For interpretation of the references to color in this figure legend, the reader is referred to the web version of this article.)
In our assay, membrane fusion between bound trypsin-treated FCoV and supported bilayers is primarily initiated with acidic buffer, although on occasion, some cleaved viruses spontaneously fuse prior to acidification. To test the influence of triggering pH on fusion kinetics, buffer solutions (150 mm NaCl, 1.5 mm MES, 5 mm citric acid) pre-calibrated over a range of acidic pH values (up to pH 7.0) were used. Each solution was sent through a microfluidic channel at a flow rate of 100 μl/min for 2 min to acidify the system. The time at which acidification of the flow cell occurred was marked by an obvious decrease in fluorescence of the pH-sensitive fluorophore, Oregon green DHPE, present in the supported bilayers for this purpose. TIRFM images were collected at an interval of 100 ms for three or 4 min. A series of images of a single virion undergoing hemifusion triggered at pH 5.3 is provided in Fig. 5 a. The dequenching spike is traced in the plot beneath the images. The time at which the onset of hemifusion occurs (following acidification at t = 0) is declared as the start of the dequenching spike for each individual virus fusion event in the field of view.
Fig. 5.

Coronavirus hemifusion kinetics after pretreatment with trypsin. (a) Images of a single coronavirus hemifusion dequenching event. The system was acidified at t = 0 to pH 5.3. The color-coded frames correspond to the time points in the curve marked with arrows. The trace plots the fluorescence in a small 4 × 4 μm region around the virus. The spike in intensity is when the hemifusion event begins. The lag time leading up to this point is the hemifusion lag time between acidification and hemifusion. (b) Many events like those in (a) are cataloged and plotted as a cumulative distribution function and fit with equation (1) for several pH values. (c) Hemifusion rate constants over a range of pH. (d) The corresponding number of spike proteins, N, determined from the statistical analysis of data. (For interpretation of the references to color in this figure legend, the reader is referred to the web version of this article.)
A cumulative distribution curve for each triggering pH was generated by plotting the frequency of hemifusion events as a function of the times of the onset of each hemifusion event. For a given triggering pH, a curve (like in Fig. 5b) is then fit with a cumulative gamma distribution (equation (1)) to estimate the kinetic parameters:
| (1) |
where k H is the hemifusion rate constant, t is time, and N is an additional fit parameter, often correlated to the number of steps or the number of fusion proteins that act together to initiate fusion [5].
A gamma distribution is commonly used to fit single particle kinetics of membrane-enveloped viral fusion because individual fusion events occur independently of each other. The gamma distribution describes a multistep reaction scheme, where each step is a stochastic Poisson process with a rate constant k. This model has been used to analyze the kinetics of single particle influenza fusion [5], [7], and because of the similarity between the class I fusion proteins of HA and S, this model is used to analyze coronavirus fusion here. The probability distribution was fit to our data using a non-linear least squares fitting algorithm.
Fig. 5c–d summarizes the hemifusion kinetic parameters obtained for trypsin-treated FCoV over a range of triggering pH: 4.0 to 6.0. We note that at pH's above 6.0, the number of fusing particles was too low to obtain statistically significant kinetic parameters. The data presented here (pH 4.0–6.0) corresponds to experiments where at least 50 fusion events occurred. What is clear from this data is that FCoV-1683 S cleaved with trypsin requires at least a mildly an acidic environment to fuse, but the rate dependence on pH is negligible. This may indicate that there is a mildly acidic pH threshold at which FCoV-1683 S becomes fusogenically active. As such, we show here that acidic pH may be considered as a subtle trigger for fusion, along with the better characterized triggers of receptor binding and proteolytic processing of S.
A second finding from these experiments is that trypsin can substitute for cathepsins in activating membrane fusion. In the absence of trypsin treatment, the total number of fusion events is less than 10% of the number of events that occur with treatment, post acidification (data not shown).
A third finding is that protease activation can occur before the virus binds the APN receptor, in contrast to the situation with SARS-CoV where the virus must first be bound to the receptor before cleavage. It is interesting to note that FCoV-1683 is one of the coronaviruses that does not need to be cleaved at the S1/S2 junction, and so this result highlights that there may be differences in receptor priming of fusion, depending on how individual coronaviruses are proteolytically activated.
3.4. Fusion pore formation
The lag time between the onset of hemifusion and pore formation can be determined from the relative time stamps of the onset of hemifusion dequenching and the onset of the release of fluorophores initially inside the virion. In Fig. 6 , a series of images of a dual-labeled, trypsin-treated FCoV fusing to the supported bilayer is shown in Fig. 6a, with the intensity quantified in Fig. 6b. The initiating pH in this experiment was 4.5. In Fig. 6b it is straightforward to determine the lag time as a difference between the dequenching spike of the green label and the drop in fluorescence of the red label. Lag times for the virions in this sample are cataloged and plotted in the bar graph in Fig. 6c. Fitting this histogram with an exponential decay, we determine that the rate constant for the formation of the pore is 0.07 ± 0.01 s−1. Pore formation was also conducted with an initiating pH of 5.0. Here the rate constant for the formation of the pore is ∼0.09 s−1. For both initiating pH's, the transition to pore formation histogram fit best to a one-step process.
Fig. 6.

(a) A single, dual-labeled coronavirus fusion event at pH 4.5. Green and red channel images of this virion undergoing hemifusion (green) and then pore formation (red). The arrows denote the virion being analyzed, which has both labels co-localized in one particle. In the red channel, a second particle is visible; however, during this span of time, it does not fuse. (b) The corresponding fluorescence intensity traces of the virion in (a). The lag time between hemifusion and pore formation for this virion is denoted by the black double-ended arrow. (c) Pore formation statistics at pH 4.5 taken from single particle fusion events, like those in (b). The bar graph shows the distribution of lag times between the hemifusion spike and the release of internal fluorescence for each dual-labeled fusing virus. (For interpretation of the references to color in this figure legend, the reader is referred to the web version of this article.)
These experiments reveal that FCoV exhibits a distinct hemifusion event before the release of internal label, which supports that coronavirus, like influenza, proceeds to pore formation via a stalk intermediate. No release of internal red label was observed prior to hemifusion of dual-labeled virions.
3.5. Comparison between class I fusion proteins, HA and S
With our results, it is now also possible to compare the fusion kinetics obtained for CoV S with the prototypical protein of this class, influenza HA. In our previous single particle kinetics studies of influenza X-31 HA membrane fusion [7], we found hemifusion and pore formation rate constants at pH 4.5 of k H ∼ 0.2 s−1 and k pore ∼ 0.08 s−1, respectively. Here, for FCoV S at the same pH, we obtain k H ∼ 0.05 s−1 and k pore ∼ 0.07 s−1, respectively. One main difference we observe between HA and S is the pH-dependence of the hemifusion rate constant. FCoV-1683 S apparently requires an acidic environment to fuse, but the rate dependence on pH is negligible. Influenza, on the other hand, exhibits pH-dependent k H [5], [7]. However, the pore formation kinetics for both viruses is approximately the same. This result is not surprising because the pore formation step is not believed to be pH dependent [43], [44], but controlled to some extent by the physico-chemical properties (e.g., lipid composition, protein content, cholesterol quantity, etc.) of the membranes involved in fusion. Since cell blebs can be made from various cell types, the method presented here for forming supported bilayers from blebs also provides a new way to interrogate the impact of cell membrane type on viral fusion kinetics.
A second difference between influenza HA and FCoV S is the value of N obtained from the kinetic analysis. N represents the number of steps in a multi-step scheme convoluted into a gamma distribution. In the case of influenza, N has been interpreted as the number of HA proteins that work in parallel to induce hemifusion [5], [7]. For influenza, N varies depending on the pH, but within the range of pH 4.0 to 6.0 is ∼3 using the same experimental acidification conditions employed in these studies. In the case of FCoV S, if this interpretation was used, our data indicates that on average 1–2 S proteins are required to induce hemifusion across the same pH range. For this interpretation, a single S protein appears to have more energy stored within it to induce fusion compared to HA. An alternative interpretation is that N in this case simply means that ∼1 step is dominating the kinetics, and that step apparently does not vary much with pH. Future experiments are required to shed more light on the mechanism of FCoV fusion and provide a conclusive interpretation of this parameter. Such studies are now ongoing in our laboratory.
3.6. Implications of this work
The formation of proteinaceous supported bilayers using the cell blebbing technique opens the possibility for quantitative characterization of membrane fusion kinetics of any enveloped virus that binds to membrane proteins in the host membrane (beyond coronaviruses) and also enables studies of unknown viral receptors in the cell membrane. Because supported bilayers can be made from many cell types [14], [17], this method can be used to obtain kinetics of virus fusion as it depends on the kind of cell membrane host. In particular, for the many viruses that engage multiple receptors or co-receptors, this method allows the role of individual receptors to be defined in the context of the fusion event. Through biochemical means, proteins can be expressed or suppressed in the plasma cell membrane. Thus, supported bilayers can be tailor-made for fundamental studies of specific host-pathogen interactions that mitigate infection. In addition, by the incorporation of pseudoparticles [9], the method may be expanded to study viruses of high biomedical importance that require enhanced biosafety procedures (BSL-3 and BSL-4).
4. Conclusions
In this work, we obtain the membrane fusion kinetics of a less-studied, but clinically important, class I fusion protein: coronavirus S. Overall, the fusion results here recapitulate what is observed in vivo, that coronavirus entry requires binding to specific receptors and that membrane fusion is both receptor- and protease-dependent. These results indicate that the in vitro method described here is a suitable substitute for studying fusion in vivo, but our method of creating and combining proteinaceous bilayers with single particle tracking, now provides a convenient way to obtain quantitative kinetic rate parameters for intermediate steps in the coronavirus fusion pathway, which to our knowledge have not been obtained before. The single particle approach combined with microfluidics offers versatile control over the sequence of triggers of binding, protease exposure, and acidification. Control of the sequence of these triggers is important, as the order may define the fusion pathway, tissue tropism, and pathogenicity of coronaviruses. Systematically varying these complex triggers using this platform provides a new way to study this virus's ability to rapidly adapt to other hosts. Versatile platforms are of critical importance to providing data that can be leveraged to limit the infection of the human population, especially in light of the recently-emerging strain of MERS-CoV.
Acknowledgments
We thank David Holowka and Barbara Baird for training D.A.C. on the blebbing technique and for useful discussions. We thank the National Science Foundation (Grant CBET-1149452) for supporting some of this work. Some experiments were performed at the Nanobiotechnology Center and Cornell NanoScale Facility, a member of the National Nanotechnology Infrastructure Network, which is supported by the National Science Foundation (Grant ECS-0335765). Work in the Whittaker lab is supported by grants from the Cornell Feline Health Center, the Winn Feline Health Foundation, and the Morris Animal Foundation.
Footnotes
Supplementary data related to this article can be found online at http://dx.doi.org/10.1016/j.biomaterials.2013.06.034.
Appendix A. Supplementary data
The following are the supplementary data related to this article:
Fig. S1. Distribution of particle diameters in cell bleb samples determined by dynamic light scattering.
Fig. S2. Lipid-only supported bilayer characterization and mobility. (a) R18 fluorescence recovery after photobleaching in a supported bilayer made from BHK-liposomes labeled with R18. The images correspond to the times for each color-coded arrow on the plot. The data are fit to curve (black line) to obtain the diffusion coefficient, as described in the Methods section. At t = 0, the bilayer was bleached with a 561 nm laser beam. The diameter of the bleached area is ∼20 μm. The reported diffusion coefficient on the plots is averaged from several experiments.
Fig. S3. Protein mobility measured by single particle tracking. fAPN labeled with Alexa-488 conjugated antibodies in an fAPN-SB. The bilayer is not labeled with R18 in this case. The bright spots in the images are antibodies bound to fAPN. This series of images is taken at 100× magnification over the course of 40 min. No substantial translation of fluorescent spots indicates that the fAPN is not mobile over this time scale.
Fig. S4. Antibody binding to various supported bilayers. Row 1: (1a) fAPN-SB (no fluorescent label); (1b) fAPN-SB with fluorescently-labeled anti-fAPN. Row 2: (2a) Empty vector-SB (control case with no fluorescent label); (2b) Empty vector-SB with fluorescently-labeled anti-fAPN.
Fig. S5. Enzymatic activity of APN in cell blebs and in supported bilayers. (a) Fluorescence intensity measured in a fluorimeter over time for hAPN blebs (red) and empty vector bleb control (blue). Intensity increases as substrate is cleaved by APN present in cell blebs. The control case is the empty vector bleb. (b) Fluorescence intensity measured inside microfluidic channel coated with hAPN-SB. The intensity is measured after 12 h. The inset shows the microchannels for the hAPN and empty vector supported bilayers under the same experimental conditions.
Fig. S6. Cleavage of FCoV-1683 by cathepsin B and trypsin. Ultracentrifuged viral preparations of FCoV 1683 were either non-treated, trypsin-treated, or cathepsin B-treated. The samples were then subjected to deglycosylation by PNGase F treatment to avoid having differentially glysosylated species of FCoV-1683 S. Samples were then analyzed by Western blot with the anti-FCoV S mAb 22G6.4.
References
- 1.Bolles M., Donaldson E., Baric R. Sars-cov and emergent coronaviruses: viral determinants of interspecies transmission. Curr Opin Virol. 2011;1(6):624–634. doi: 10.1016/j.coviro.2011.10.012. [DOI] [PMC free article] [PubMed] [Google Scholar]
- 2.Raj V.S., Mou H., Smits S.L., Dekkers D.H.W., Muller M.A., Dijkman R., et al. Dipeptidyl peptidase 4 is a functional receptor for the emerging human coronavirus-EMC. Nature. 2013;495(7440):251–254. doi: 10.1038/nature12005. [DOI] [PMC free article] [PubMed] [Google Scholar]
- 3.de Groot R.J., Baker S.C., Baric R.S., Brown C.S., Drosten C., Enjuanes L., et al. Middle east respiratory syndrome coronavirus (MERS-CoV); announcement of the coronavirus study group. J Virol. 2013;87:7790–7792. doi: 10.1128/JVI.01244-13. [DOI] [PMC free article] [PubMed] [Google Scholar]
- 4.Axelrod D., Burghardt T.P., Thompson N.L. Total internal reflection fluorescence. Ann Rev Biophys Bioeng. 1984;13:247–268. doi: 10.1146/annurev.bb.13.060184.001335. [DOI] [PubMed] [Google Scholar]
- 5.Floyd D.L., Ragain J.R., Skehel J.J., Harrison S.C., van Oijen A.M. Single-particle kinetics of influenza virus membrane fusion. Proc Natl Acad Sci U S A. 2008;105:15382–15387. doi: 10.1073/pnas.0807771105. [DOI] [PMC free article] [PubMed] [Google Scholar]
- 6.Ivanovic T., Rozendaal R., Floyd D.L., Popvic M., Van Oijen A.M., Harrison S.C. Kinetics of proton transport into influenza virions by the viral m2 channel. PLoS ONE. 2012;7:e31566. doi: 10.1371/journal.pone.0031566. [DOI] [PMC free article] [PubMed] [Google Scholar]
- 7.Costello D.A., Lee D.W., Drewes J., Vasquez K.A., Kisler K., Weisner U., et al. Influenza virus-membrane fusion triggered by proton uncaging for single particle studies of fusion kinetics. Anal Chem. 2012;84:8480–8489. doi: 10.1021/ac3006473. [DOI] [PMC free article] [PubMed] [Google Scholar]
- 8.Wessels L., Elting M.W., Scimeca D., Weninger K. Rapid membrane fusion of individual virus particles with supported lipid bilayers. Biophys J. 2007;93:526–538. doi: 10.1529/biophysj.106.097485. [DOI] [PMC free article] [PubMed] [Google Scholar]
- 9.Matos P.M., Marin M., Ahn B., Lam W., Santos N.C., Melikyan G.B. Anionic lipids are required for vesicular stomatitis virus G protein-mediated single particle fusion with supported lipid bilayers. J Biol Chem. 2013;288(18):12416–12425. doi: 10.1074/jbc.M113.462028. [DOI] [PMC free article] [PubMed] [Google Scholar]
- 10.Graham R.L., Baric R.S. Recombination, reservoirs, and the modular spike: mechanisms of coronavirus cross-species transmission. J Virol. 2010;84(7):3134–3146. doi: 10.1128/JVI.01394-09. [DOI] [PMC free article] [PubMed] [Google Scholar]
- 11.Tresnan D.B., Levis R., Holmes K.V. Feline aminopeptidase N serves as a receptor for feline, canine, porcine, and human coronaviruses in serogroup I. J Virol. 1996;70(12):8669–8674. doi: 10.1128/jvi.70.12.8669-8674.1996. [DOI] [PMC free article] [PubMed] [Google Scholar]
- 12.Tusell S.M., Schittone S.A., Holmes K.V. Mutational analysis of aminopeptidase N, a receptor for several group I coronaviruses, identifies key determinants of viral host range. J Virol. 2007;81(3):1261–1273. doi: 10.1128/JVI.01510-06. [DOI] [PMC free article] [PubMed] [Google Scholar]
- 13.Yeager C.L., Ashmun R.A., Williams R.K., Cardellichio C.B., Shapiro L.H., Look A.T., et al. Human aminopeptidase N is a receptor for human coronavirus 229e. Nature. 1992;357(6377):420–422. doi: 10.1038/357420a0. [DOI] [PMC free article] [PubMed] [Google Scholar]
- 14.Scott R.E., Perkins R.G., Zschunke M.A., Hoerl B.J., Maercklein P.B. Plasma membrane vesiculation: a new technique for isolation of plasma membranes. Science. 1976;194:743–745. doi: 10.1126/science.982044. [DOI] [PubMed] [Google Scholar]
- 15.Holowka D., Baird B. Structural studies on the membrane-bound immunoglobulin E-receptor complex.1. Characterization of large plasma-membrane vesicles from rat basophilic leukemia-cells and insertion of amphipathic fluorescent-probes. Biochemistry. 1983;22(14):3466–3474. doi: 10.1021/bi00283a025. [DOI] [PubMed] [Google Scholar]
- 16.Baumgart T., Hammond A.T., Sengupta P., Hess S.T., Holowka D.A., Baird B.A., et al. Large-scale fluid/fluid phase separation of proteins and lipids in giant plasma membrane vesicles. Proc Natl Acad Sci U S A. 2007;104(9):3165–3170. doi: 10.1073/pnas.0611357104. [DOI] [PMC free article] [PubMed] [Google Scholar]
- 17.Sezgin E., Kaiser H.-J., Baumgart T., Schwille P., Simons K., Levental I. Elucidating membrane structure and protein behavior using giant plasma membrane vesicles. Nat Protoc. 2012;7(6):1042–1051. doi: 10.1038/nprot.2012.059. [DOI] [PubMed] [Google Scholar]
- 18.Costello D.A., Hsia C.-Y., Millet J.K., Porri T., Daniel S. Membrane fusion-competent virus-like proteoliposomes and proteinaceous supported bilayers made directly from cell plasma membranes. Langmuir. 2013;29(21):6409–6419. doi: 10.1021/la400861u. [DOI] [PubMed] [Google Scholar]
- 19.Bosch B.J., Rottier P.J. In: Nidoviruses. Perlman S., Gallagher T., Snijder E.J., editors. ASM Press; Washington DC: 2008. Nidovirus entry into cells; pp. 157–178. [Google Scholar]
- 20.White J.M., Delos S.E., Brecher M., Schornberg K. Structures and mechanisms of viral membrane fusion proteins: multiple variations on a common theme. Crit Rev Biochem Mol Biol. 2008;43(3):189–219. doi: 10.1080/10409230802058320. [DOI] [PMC free article] [PubMed] [Google Scholar]
- 21.Bosch B.J., van der Zee R., de Haan C.A., Rottier P.J. The coronavirus spike protein is a class I virus fusion protein: structural and functional characterization of the fusion core complex. J Virol. 2003;77(16):8801–8811. doi: 10.1128/JVI.77.16.8801-8811.2003. [DOI] [PMC free article] [PubMed] [Google Scholar]
- 22.Belouzard S., Millet J.K., Licitra B.N., Whittaker G.R. Mechanisms of coronavirus cell entry mediated by the viral spike protein. Viruses. 2012;4:1011–1033. doi: 10.3390/v4061011. [DOI] [PMC free article] [PubMed] [Google Scholar]
- 23.Madu I.G., Roth S.L., Belouzard S., Whittaker G.R. Characterization of a highly conserved domain within the severe acute respiratory syndrome coronavirus spike protein S2 domain with characteristics of a viral fusion peptide. J Virol. 2009;83(15):7411–7421. doi: 10.1128/JVI.00079-09. [DOI] [PMC free article] [PubMed] [Google Scholar]
- 24.Matsuyama S., Ujike M., Morikawa S., Tashiro M., Taguchi F. Protease-mediated enhancement of severe acute respiratory syndrome coronavirus infection. Proc Natl Acad Sci U S A. 2005;102(35):12543–12547. doi: 10.1073/pnas.0503203102. [DOI] [PMC free article] [PubMed] [Google Scholar]
- 25.Regan A.D., Shraybman R., Cohen R.D., Whittaker G.R. Differential role for low pH and cathepsin-mediated cleavage of the viral spike protein during entry of serotype II feline coronaviruses. Vet Microbiol. 2008;132(3–4):235–248. doi: 10.1016/j.vetmic.2008.05.019. [DOI] [PMC free article] [PubMed] [Google Scholar]
- 26.Sobo K., Chevallier J., Parton R.G., Gruenberg J., van der Goot F.G. Diversity of raft-like domains in late endosomes. PLoS ONE. 2007;2(4):e391. doi: 10.1371/journal.pone.0000391. [DOI] [PMC free article] [PubMed] [Google Scholar]
- 27.Hoekstra D., de Boer T., Klappe K., Wilschut J. Fluorescence method for measuring the kinetics of fusion between biological membranes. Biochemistry. 1984;23:5675–5681. doi: 10.1021/bi00319a002. [DOI] [PubMed] [Google Scholar]
- 28.Loyter A., Citovsky V.B.R. In: The use of fluoroescence dequenching measurements to follow viral membrane fusion events. Glick D., editor. John Wiley & Sons, Inc; 1988. [DOI] [PubMed] [Google Scholar]
- 29.Soumpasis D.M. Theoretical analysis of fluorescence photobleaching recovery experiments. Biophys J. 1983;41:95–97. doi: 10.1016/S0006-3495(83)84410-5. [DOI] [PMC free article] [PubMed] [Google Scholar]
- 30.Hohdatsu T., Izumiya Y., Yokoyama Y., Kida K., Koyama H. Differences in virus receptor for type I and type II feline infectious peritonitis virus. Arch Virol. 1998;143(5):839–850. doi: 10.1007/s007050050336. [DOI] [PMC free article] [PubMed] [Google Scholar]
- 31.Taylor A. Aminopeptidases: structure and function. FASEB J. 1993;7(2):290–298. doi: 10.1096/fasebj.7.2.8440407. [DOI] [PubMed] [Google Scholar]
- 32.Reguera J., Santiago C., Mudgal G., Ordoño D., Enjuanes L., Casasnovas J.M. Structural bases of coronavirus attachment to host aminopeptidase N and its inhibition by neutralizing antibodies. PLoS Pathogens. 2012;8(8):e1002859. doi: 10.1371/journal.ppat.1002859. [DOI] [PMC free article] [PubMed] [Google Scholar]
- 33.Kominami E., Ueno T., Muno D., Katunuma N. The selective role of cathepsins b and d in the lysosomal degradation of endogenous and exogenous proteins. FEBS Lett. 1991;287(1–2):189–192. doi: 10.1016/0014-5793(91)80048-8. [DOI] [PubMed] [Google Scholar]
- 34.Huang I.C., Bosch B.J., Li F., Li W., Lee K.H., Ghiran S., et al. SARS coronavirus, but not human coronavirus NL63, utilizes cathepsin l to infect ace2-expressing cells. J Biol Chem. 2005;10:3198–3203. doi: 10.1074/jbc.M508381200. [DOI] [PMC free article] [PubMed] [Google Scholar]
- 35.Qiu Z., Hingley S.T., Simmons G., Yu C., Das Sarma J., Bates P., et al. Endosomal proteolysis by cathepsins is necessary for murine coronavirus mouse hepatitis virus type 2 spike-mediated entry. J Virol. 2006;80(12):5768–5776. doi: 10.1128/JVI.00442-06. [DOI] [PMC free article] [PubMed] [Google Scholar]
- 36.Simmons G., Rennekamp A.J., Bates P. Proteolysis of SARS-associated coronavirus spike glycoprotein. Adv Exp Med Biol. 2006;581:235–240. doi: 10.1007/978-0-387-33012-9_39. [DOI] [PMC free article] [PubMed] [Google Scholar]
- 37.Bosch B.J., Bartelink W., Rottier P.J. Cathepsin l functionally cleaves the SARS-CoV class I fusion protein upstream of rather than adjacent to the fusion peptide. J Virol. 2008;82(17):8887–8890. doi: 10.1128/JVI.00415-08. [DOI] [PMC free article] [PubMed] [Google Scholar]
- 38.Rawlings N.D., Barrett A.J. In: Methods in enzymology. Alan J.B., editor. Academic Press; 1994. Families of serine peptidases; pp. 19–61. [DOI] [PMC free article] [PubMed] [Google Scholar]
- 39.Belouzard S., Chu V.C., Whittaker G.R. Activation of the SARS coronavirus spike protein via sequential proteolytic cleavage at two distinct sites. Proc Natl Acad Sci U S A. 2009;106(14):5871–5876. doi: 10.1073/pnas.0809524106. [DOI] [PMC free article] [PubMed] [Google Scholar]
- 40.Floyd D.L., Harrison S.C., van Oijen A.M. Analysis of kinetic intermediates in single-particle dwell-time distributions. Biophys J. 2010;99:360–366. doi: 10.1016/j.bpj.2010.04.049. [DOI] [PMC free article] [PubMed] [Google Scholar]
- 41.Brian A.A., McConnell H.M. Allogeneic stimulation of cytotoxic T cells by supported planar membranes. Proc Natl Acad Sci U S A. 1984;81:6159–6163. doi: 10.1073/pnas.81.19.6159. [DOI] [PMC free article] [PubMed] [Google Scholar]
- 42.Yang T., Jung S.-Y., Mao H., Cremer P.S. Fabrication of phospholipid bilayer-coated microchannels for on-chip immunoassays. Anal Chem. 2001;73:165–169. doi: 10.1021/ac000997o. [DOI] [PubMed] [Google Scholar]
- 43.Stegmann T., White J.M., Helenius A. Intermediates in influenza induced membrane fusion. EMBO J. 1990;9:4231–4241. doi: 10.1002/j.1460-2075.1990.tb07871.x. [DOI] [PMC free article] [PubMed] [Google Scholar]
- 44.Blumenthal R., Schoch C., Puri A., Clague M.J. A dissection of steps leading to viral envelope protein-meditaed membrane fusion. Ann New York Acad Sci. 1991;635:285–296. doi: 10.1111/j.1749-6632.1991.tb36499.x. [DOI] [PubMed] [Google Scholar]
Associated Data
This section collects any data citations, data availability statements, or supplementary materials included in this article.