
Fig. 4.
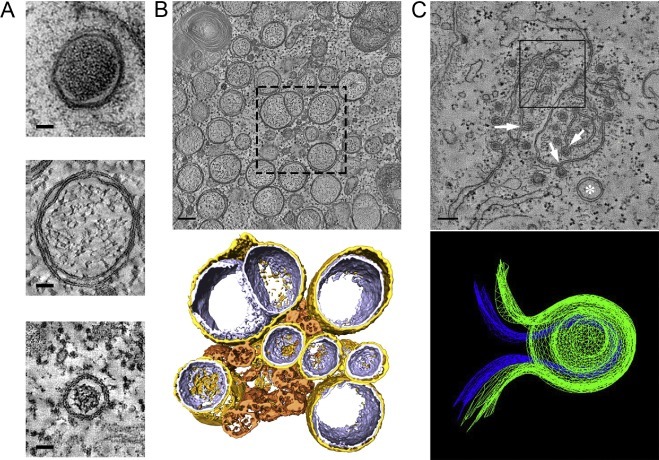
Coronavirus-induced membrane structures. (A) Gallery of nidovirus-induced DMVs represented to scale. The panel shows DMVs in cells infected with (from top to bottom) IBV (CK cells, HPF-FS), SARS-CoV (Vero E6, plunge-freezing and FS) and EAV (HuH-7 cells, HPF-FS). The top image is a 2D projection, while the middle and bottom images are virtual slices (2 nm thick) extracted from tomograms. (B) Membrane modifications induced by SARS-CoV infection in Vero E6 cells (7 h p.i.). The top panel is a 2-nm thick virtual slice from a tomogram. The boxed area represents the region that was used for the 3D surface rendering in the lower panel. In this model, gold represents the outer membrane of the DMV is coloured in gold, the inner membrane in silver, and CM in bronze. (C) Membrane modifications induced by IBV infection in CK cells (16 h p.i., chemical fixation) The upper panel is a virtual slice taken from a tomogram in a region rich in IBV-induced zippered membranes where a DMV (white asterisk) is also present. These zippered membranes often curve to form spherules with a neck that connects their interior to the cytosol (white arrows). The upper spherule in the boxed region was used to create the 3D mesh model presented in the lower panel. Blue represents the inner membrane and green the outer membrane of the spherule. Scale bars, 50 nm (A), 100 nm (B,C). A (middle), B: adapted from (Knoops et al., 2008). A (top), C: adapted from (Maier et al., 2013b). (For interpretation of the references to colour in this figure legend, the reader is referred to the web version of this article.)