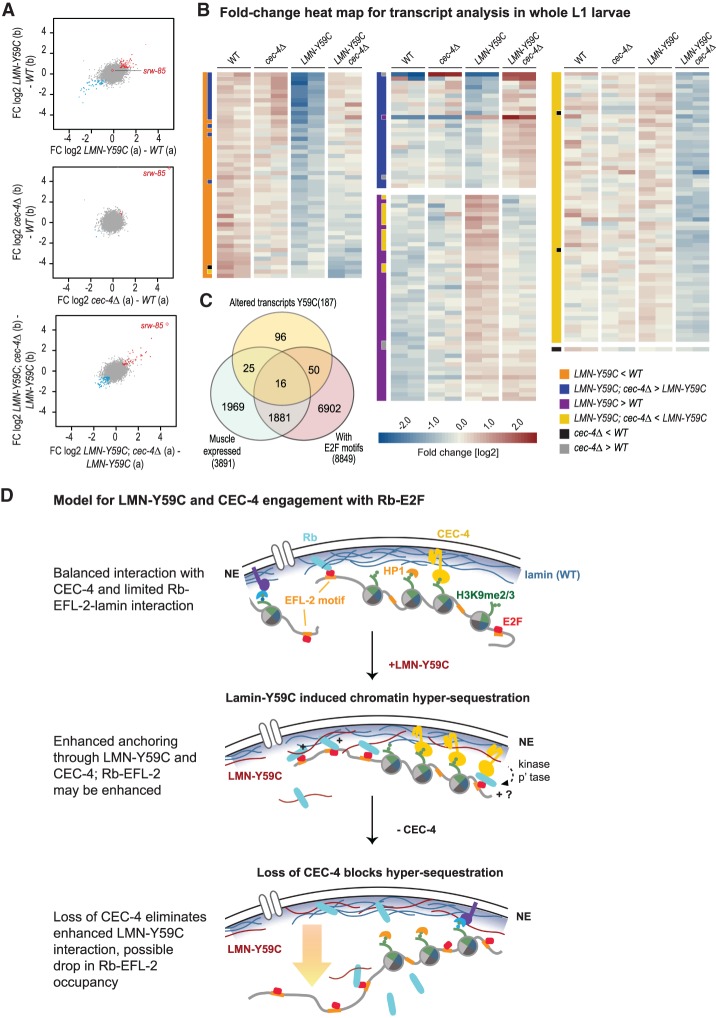
Figure 7.
RNA-seq shows compensatory effects of cec-4Δ on LMN-Y59C-induced transcriptional changes. (A) Scatter plots visualizing the replicate concordance of log2 fold changes (FC) in differential transcript abundances contrasting the two replicas (shown in A,B). (Top) LMN-Y59C (GW653) compared with wild type (WT, N2). (Middle) cec-4Δ (GW828) compared with WT. (Bottom) LMN-Y59C; cec-4Δ (GW1468) compared with LMN-Y59C (GW653). (Blue) Differential genes (P < 0.01) down in both replica pairs [<−log2(1.5×)]; (red) differential genes (P < 0.01) up in both [> log2(1.5×)]. (Red open diamond) srw-85, a gene up-regulated in cec-4Δ embryos (Gonzalez-Sandoval et al. 2015). (B) Heat map visualizing relative transcript abundances in L1 whole larval RNA in two replicates of each strain (see A). Each row represents a gene identified as differential by edgeR (FDR < 0.01 and FC > 1.5 over the indicated comparison based on average values). The two-column bar at the left of each gene set indicates the comparisons used to define the given gene set. Each subset is sorted by the FC between “LMN-Y59C” over “LMN-Y59C; cec4Δ” (last four columns). The color scale in the heat map indicates the FC deviation from the gene-wise average transcript abundance over all samples. (C) Venn diagram of altered transcripts in mutant LMN-Y59C L1 larvae, muscle-expressed genes (Blazie et al. 2015), and genes with putative E2F sites (EFL-1 and EFL-2 pooled). (D) A model for LMN-Y59C and CEC-4 interaction with possible role for Rb-EFL-2. The top sketch indicates the INM components and chromatin components relevant for sequence positioning in differentiated muscle of C. elegans. In purple is a hypothesized unknown anchor. (Middle and bottom) The gain-of-function LMN-Y59C mutation confers enhanced Rb-EFL-2 and/or enhanced CEC-4 binding, and the loss of CEC-4 counteracts this. (p'tase) Phosphatase.

