Figure 4.

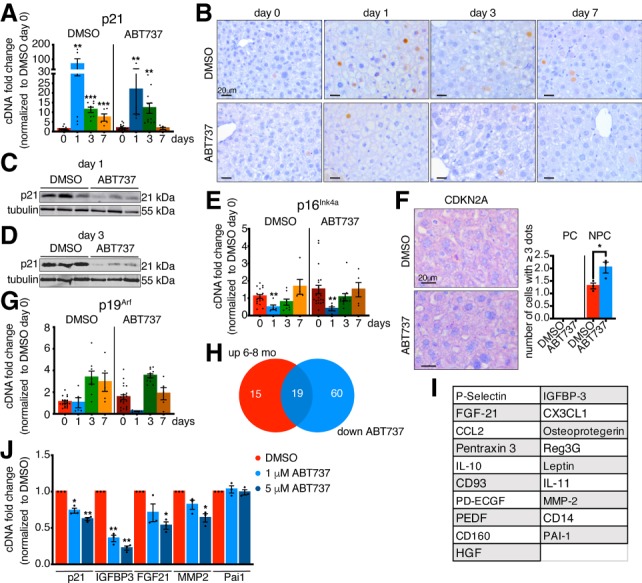
ABT-737 decreases expression of p21 and SASP factors. (A) qPCR analysis for p21 in DMSO- and ABT-737-treated livers at different days after PH normalized to DMSO day 0 (n = 5–21). (B) Immunohistochemistry for p21 in DMSO- and ABT-737-treated livers at different time points after PH. All images are representative of at least four biological replicates. Scale bars, 20 µm. (C,D) p21 expression following treatment with DMSO or ABT-737 in whole liver lysates 1 d (C) and 3 d (D) after PH measured by Western blot. Tubulin was used as a loading control (n = 3). (E) qPCR analysis for p16Ink4a in DMSO- and ABT-737-treated livers at different days after PH normalized to DMSO day 0 (n = 5–21). (F) RNA ISH staining and quantification for CDKN2A in DMSO and ABT737 liver sections before PH (day 0). All images are representative of at least three biological replicates. Scale bars, 20 µm. Quantification shows number of cells/field of view that have three or more dots/cell. (n = 3) (PC) Parenchymal cells; (NPC) nonparenchymal cells. (G) qPCR analysis for p19Arf in DMSO- and ABT-737-treated livers at different days after PH normalized to DMSO day 0 (n = 5–21). (H) Venn diagram showing the overlap in 6- to 8-mo-old liver lysates ≥1.5-fold up-regulated proteins (compared with 2- to 3-mo-old liver lysates) and in ABT737-treated liver lysates ≤0.6-fold down-regulated proteins (compared with DMSO-treated liver lysates) (n = 2). (I) List of 19 overlapping proteins of Venn diagram in H. (J) qPCR analysis for p21 and selected SASP factors in DMSO- or ABT737-treated dermal fibroblasts 4 d after continuous treatment (n = 3). Error bars, mean ± SEM, unpaired two-tailed Student's t-test. (*) P ≤ 0.05; (**) P ≤ 0.01 (***) P ≤ 0.001.
