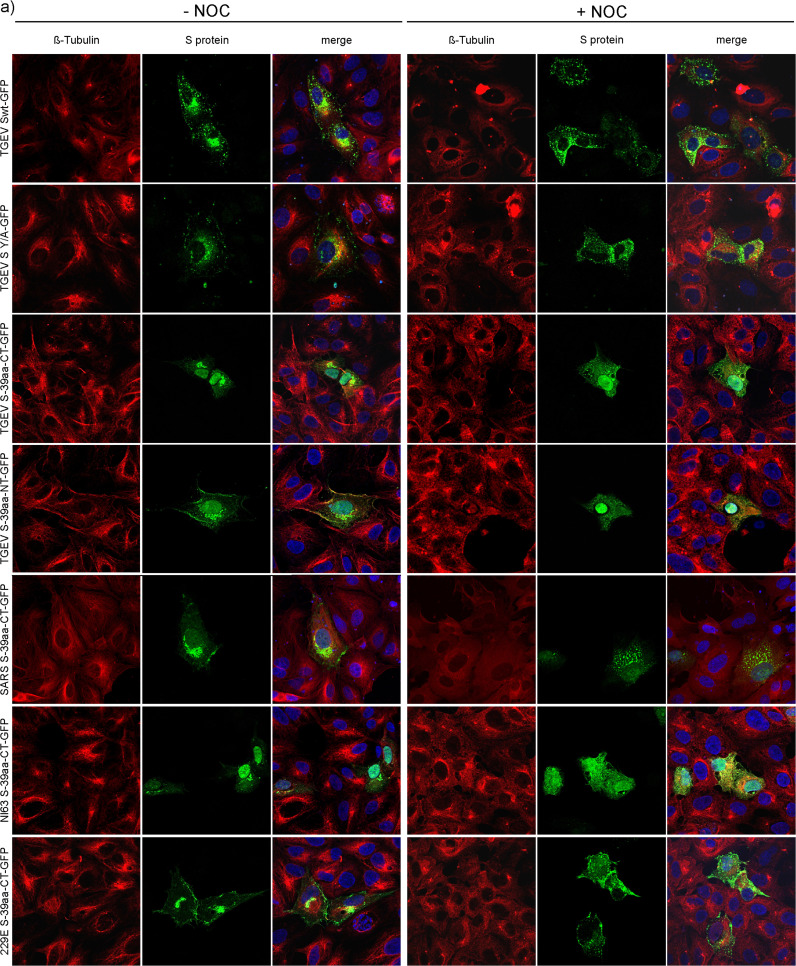
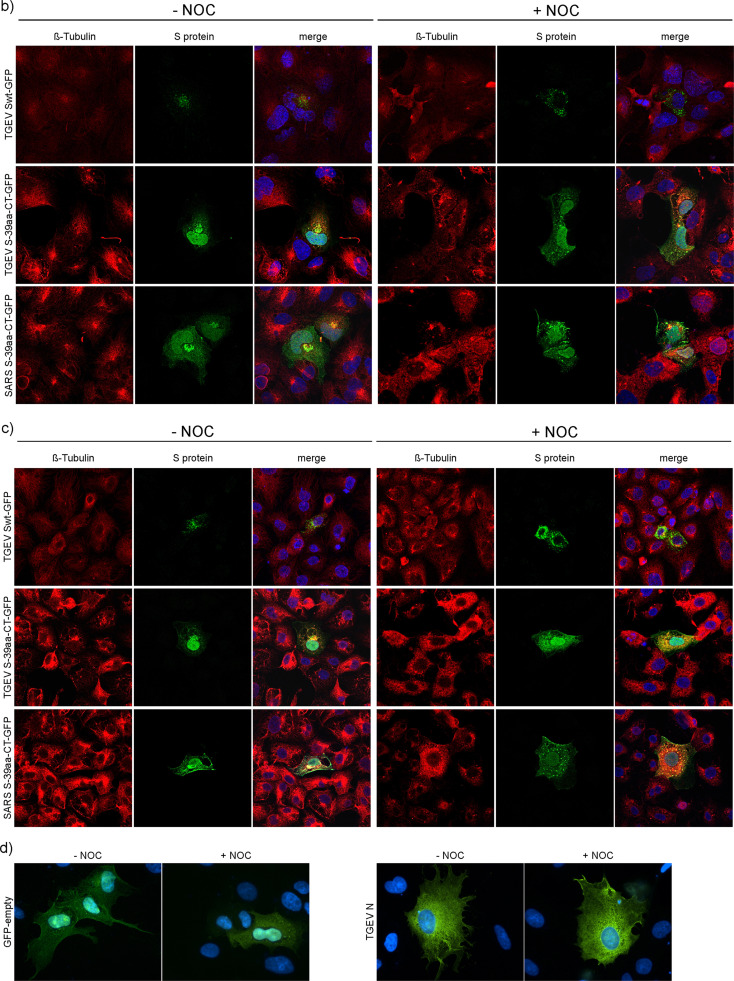
Fig. 3.
S protein expression in untreated and NOC treated cells 7 hpt. ST cells transfected with different S constructs fused to GFP (a); S-expressing HypNi/1.1 cells (b); S-expressing PipNi/1 cells (c); GFP- and TGEV N-expressing ST cells as negative control (d); Expression of authentic β-tubulin (red), S proteins or single GFP and TGEV N protein (green), nuclei stained with DAPI (blue). Cells treated with DMSO (−NOC) or treated with NOC (+NOC). Immunofluorescence analysis was done by confocal microscopy using Leica TCS SP5.


