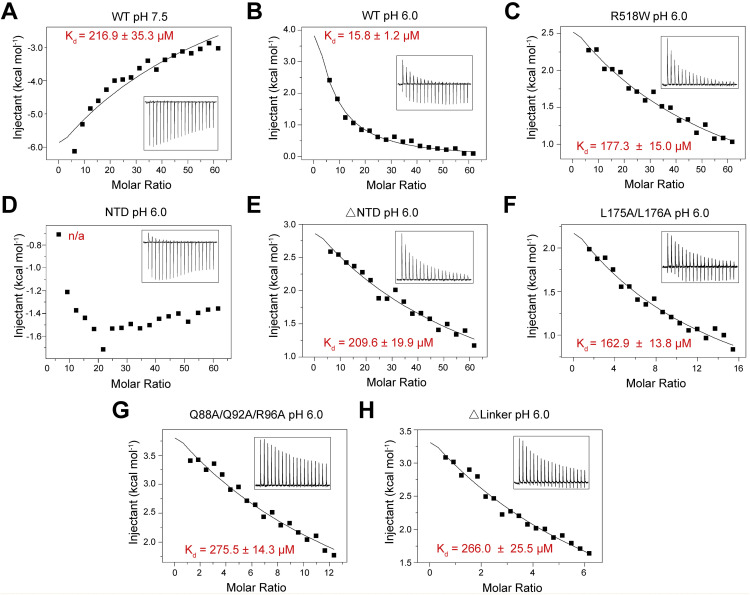
Figure S4.
Measurement of the Binding Affinity between Human NPC2 (hNPC2) and hNPC1 Variants, Related to Table 1
Please refer to Supplemental Experimental Procedures for details of experiments and data fitting. A summary of the binding affinity is shown in Table 1.
(A and B) Measurement of the affinity between WT hNPC1 and hNPC2 at pH 7.5 (A) and pH 6.0 (B).
(C–H) Measurement of the binding affinity between hNPC2 and the indicated hNPC1 variants. All the measurements were conducted at pH 6.0. NTD: residues 1-252; ΔNTD: FL deletion of residues 25-257 from FL protein; ΔLinker: internal deletion of the Pro-rich segments 249PKPQPPPPP257.

