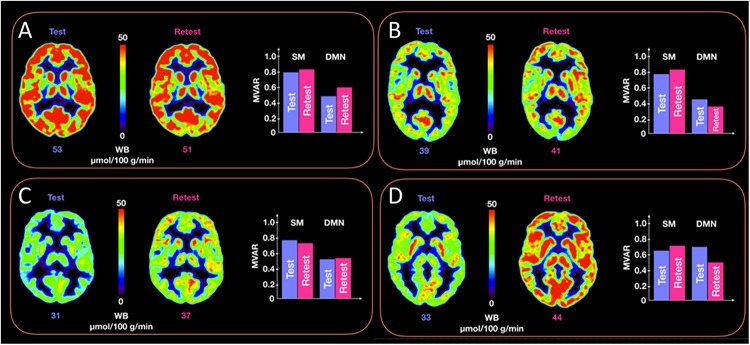
FIGURE 5.
Representative CMRGlc images with low (top row, panels A,B) and high (bottom row, panels C,D) test-retest variability. Each of the four panels (A–D) corresponds to a different subject at rest and retest condition. Each panel renders a trans-axial cross-section through the subject’s brain at the level of the caudate head obtained at rest and retest condition, together with bar graphs representing test-retest changes in MVAR coefficients for the DMN and Sensory-motor (SM) networks. The figure demonstrates a similar distribution of MVAR coefficient changes for subjects with low (top row) and high (bottom row) CMRGlc variability across time. WB, whole brain values.

