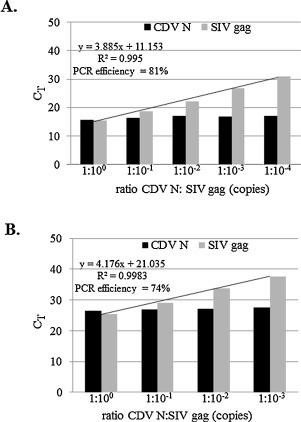
Supplemental Fig. 2.

Response of the duplex RT-qPCR assay on the CT values of different ratios of CDV N-to-gag RNA concentrations in a sample. (A) N oligoribonucleotide template held constant at 1 × 10⁷ copies per RT-qPCR while serially titrating the gag template 10-fold over a range from 1 × 10⁷ to 1 × 10³ copies. (B). N oligoribonucleotide template held at 1 × 10⁴ copies per RT-qPCR while serially titrating the gag template 10-fold from 1 × 10⁴ to 1 × 101 copies. CT values (vertical axis) for each target RNA and ratios of CDV N: SIV copies (horizontal axis). Standard curves were generated by plotting the log of gag genome copies against the measured cycle threshold (CT). All CT values are means of duplicates.
