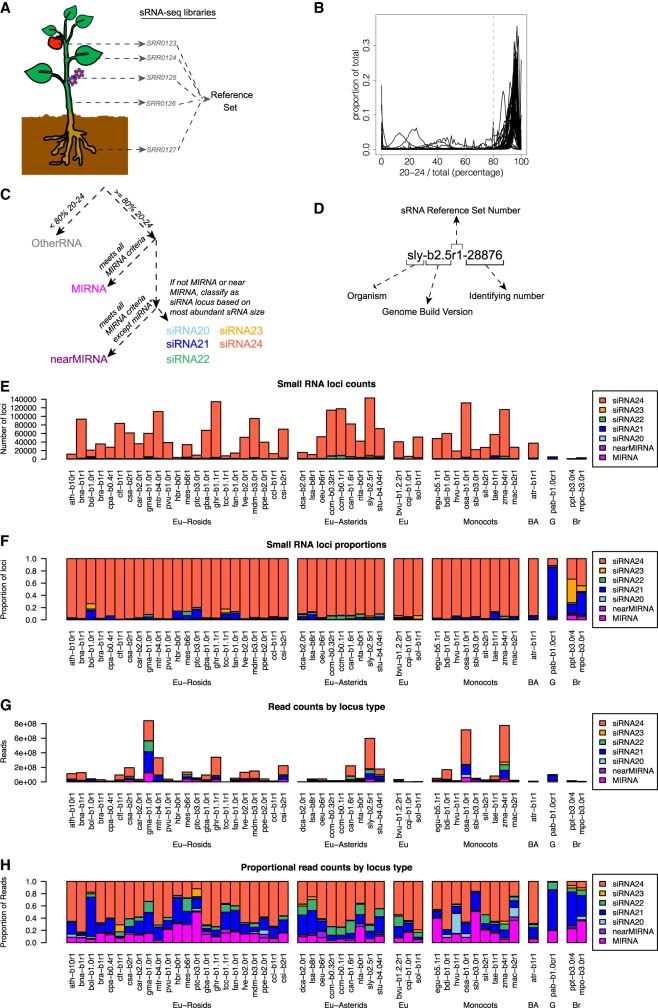
Figure 1.
Overview of sRNA locus annotation pipeline and summary of annotated sRNA loci. (A) Schematic illustrating how multiple sRNA libraries from diverse plant tissues are merged to create a “reference set” of sRNAs for a given species. Accession numbers shown are fictional. (B) Distributions of the fractions of sRNAs between 20 and 24 nt in length (inclusive) within all loci in each genome. Gray line at 80% represents the cutoff used to discriminate silencing-related RNA loci from other types of sRNA-producing loci. (C) Flowchart illustrating the ontology used to classify sRNA-producing loci. Colors designating different locus types are used throughout this work. (D) Schematic illustrating the nomenclature used to annotate sRNA-producing loci. (E–H) Summary of annotated sRNA loci, by species and locus type, excluding the category “OtherRNA.” (E) Counts of annotated loci. (F) Proportions of annotated loci. (G) Total counts of aligned small RNAs in reference sets. (H) Proportions of small RNA total read counts in reference sets. See Table 1 for species codes. (Eu) eudicots; (BA) basal angiosperm; (G) gymnosperm; (Br) bryophyte.

