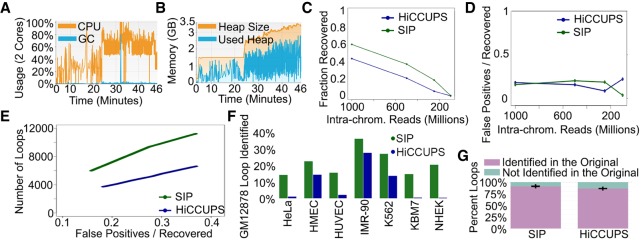
Figure 2.
Performance of SIP. (A) CPU usage (orange) and GC (garbage collection, blue) over time using two cores during SIP loop calling. (B) Memory usage of SIP during loop calling. (C) Fraction of loops called using the full data set recovered by SIP (green) or by HiCCUPS (blue) in data down-sampled to different sequencing depths. (D) Ratio of false positives (loops not identified in the full data set) versus loops recovered by SIP (green) or HiCCUPS (blue) in down-sampled data. (E) Number of loops identified in down-sampled data (y-axis) for SIP (green) and HiCCUPS (blue) when parameters were adjusted to give the same false positive/recovery rate (x-axis). (F) Percentage of loops identified by SIP (green) or HiCCUPS (blue) in GM12878 cells that were identified in a different cell type. (G) Percentage of loops identified in each permutation down-sampling data (purple) versus new loops (i.e., false positives) (teal). Bars represent averages of 10 permutations with error bars representing standard deviation.

