Figure 3.
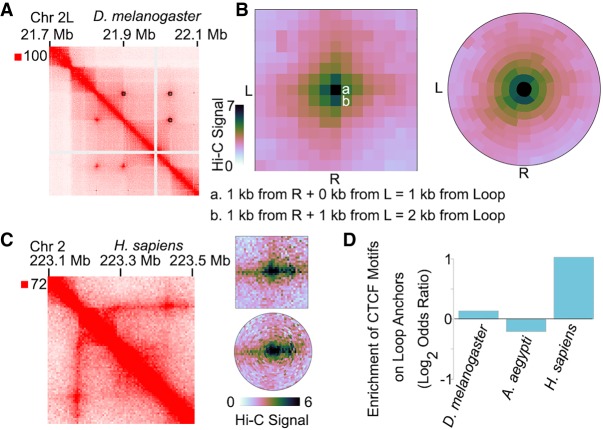
SIP and SIPMeta can be used to detect and analyze loops in different species. (A) Example locus for SIP loops detected in Hi-C for D. melanogaster. (B) Left: Metaplot of SIP loops illustrating that the Manhattan distance between a and b is different with respect to loops but is visually depicted as the same distance in square metaplots. (L) left anchor, (R) right anchor. Right: Metaplot of SIP loops illustrating the bullseye transformation performed by SIPMeta. (C) Left: Example locus in GM12878 cells for a stripe detected in Hi-C maps of mammals. Right: SIPMeta plots displaying how stripes appear in square versus bullseye plots. (D) Enrichment of CTCF motifs on loop anchors in D. melanogaster, A. aegypti, and H. sapiens.

