Figure 4.
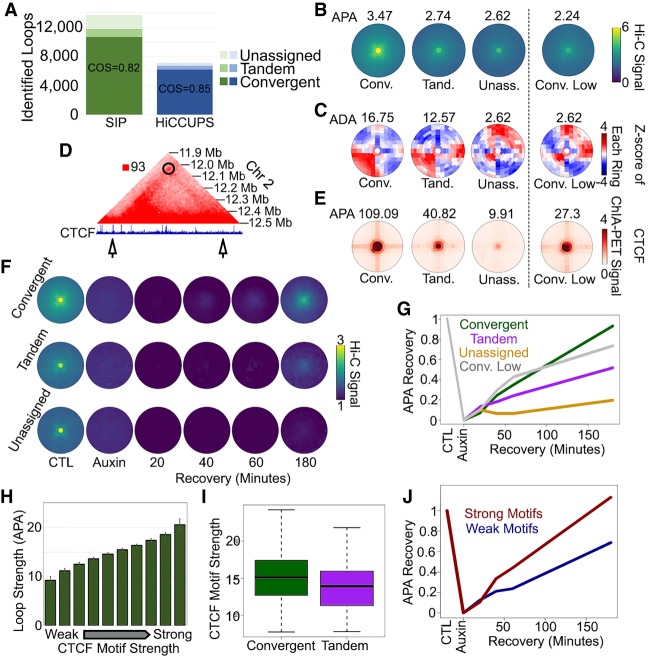
Characterization of CTCF loops with SIPMeta. (A) Number of loops in GM12878 cells at 5-kb resolution identified by SIP (green) or by HiCCUPS (blue) corresponding to CTCF sites in convergent, tandem, or in orientations that could not be assigned. The number of loops in divergent orientation was negligible and could not be depicted. (B,C) SIPMeta bullseye plots (B) or Z-score plots (C) of SIP loops in categories based on CTCF motif orientation. (APA) Aggregate peak analysis, (ADA) aggregate domain analysis. (D) Example of a SIP loop unassignable to any CTCF orientation. CTCF ChIP-seq signal is shown below. Arrows indicate loop anchors. (E) SIPMeta bullseye plots of CTCF HiChIP data for SIP loops in categories based on CTCF motif orientation. (F) Metaplots for SIP loops in each CTCF category in control, cohesin depletion, and recovery in Hi-C data obtained in HCT116 cells. (G) APA score changes after cohesin recovery relative to control and cohesin depletion Hi-C. (H) Average APA scores of convergent CTCF loops divided into 10 equal categories based on the strength of motifs found on loop anchors. Error bars indicate standard deviation. (I) CTCF motif scores on convergent versus tandem loops. (J) APA score changes after cohesin recovery relative to control and cohesin depletion Hi-C for convergent loops with the strongest (red) and weakest (blue) 10% motif scores.

