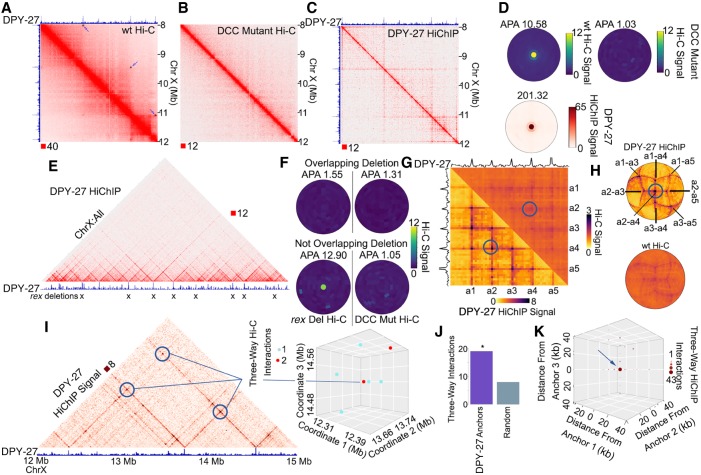
Figure 6.
A network of condensin I-DCC loops in C. elegans. (A) Hi-C contact map showing domains and loops on the X Chromosome of C. elegans hermaphrodites. Black squares with arrows depict loops called by SIP. Top track displays the DPY-27 ChIP-seq signal across the region. (B) Hi-C in the DCC mutant sdc-2 (y93, RNAi) from Anderson et al. (2019) showing lack of loops on the X Chromosome. (C) DPY-27 HiChIP contact map depicting the enrichment of loops. Top track displays the DPY-27 ChIP-seq signal across the region. (D) SIPMeta bullseye plot of C. elegans SIP loops on the X Chromosome displaying the average wild-type Hi-C (top left), or DCC mutant Hi-C (top right), or DPY-27 HiChIP (bottom) signal. (E) X Chromosome–wide view of DPY-27 HiChIP signal. Bottom track displays the DPY-27 ChIP-seq signal across the region. Xs indicate sites deleted in Anderson et al. (2019). (F) SIPMeta bullseye plots of Hi-C data after eight rex site deletions (left) or after mutation of the DCC (right). SIP loops that overlap with deleted rex sites (top) or do not overlap with deleted rex sites (bottom). (G) Scaled metaplots of interactions between every DPY-27 loop anchor with its closest four others shown by Hi-C (top right) and by DPY-27 HiChIP (bottom left). The top and side tracks depict the median DPY-27 ChIP-seq signal. Blue circle indicates the point chosen as the center of bullseye plots shown later. (H) SIPMeta bullseye plots for DPY-27 HiChIP (top) and Hi-C (bottom) centered on the interaction between a2-a4. (I) DPY-27 HiChIP contact map depicting a network of two-way interactions between three anchors found to participate in three-way interactions. Bottom track shows DPY-27 ChIP-seq signal. 3D scatterplot of three-way interactions for the chromosome coordinates shown. (J) Number of three-way interactions discovered by Hi-C connecting DPY-27 loop anchors or the average of permutations using an equal number of random regions on the X Chromosome. (*) P < 0.05 Monte Carlo permutation test. (K) Profile of three-way interactions across all possible three-way DPY-27 loop anchor connections.

