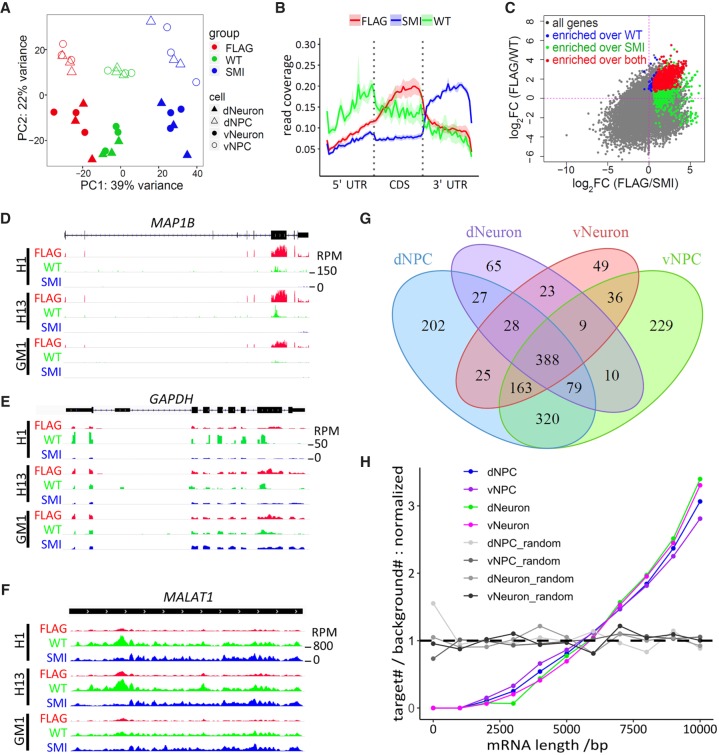
Figure 2.
Identification of FMR1 targets by CLIP in human neural cells. (A) PCA plot of CLIP-seq data. Color and shapes represent experimental conditions and cell types. (B) Line plots show relative distribution of reads over gene elements. (5′ UTR / 3′ UTR) 5′ and 3′ untranslated region, (CDS) coding sequence. Reads mapped to protein-coding genes of all samples were used for the analysis. Lines and shades represent mean ± SE. (C) Representative scatter plot of log2(fold change) (cell: dNPC) shows that FMR1 targets (red) were defined as significantly enriched in the FLAG group over both WT control (blue) and SMI control (green). Gray genes were not significantly enriched in the FLAG group over either control. (D–F) Visualization of reads by Integrative Genomics Viewer (IGV) (Thorvaldsdottir et al. 2013) on representative FMR1 target, MAP1B (D), and nontargets, GAPDH (E) and MALAT1 (F). Tracks of dNPC are shown. Scale of height (RPM) is the same for all tracks in the same panel. (G) Venn diagram showing overlaps of FMR1 targets identified in four cell types analyzed. (H) Analysis of length distribution of FMR1 targets in various cell types. Line plots show normalized ratio of number of targets to number of background genes at 1000-bp windows of mRNA lengths. The random sets were the same number of genes randomly picked from the background genes (protein-coding genes with a RPKM > 0.1). P < 2.2 × 10⁻¹⁶ for each of the four cell types, two-sample Kolmogorov–Smirnov test comparing targets to background genes.

