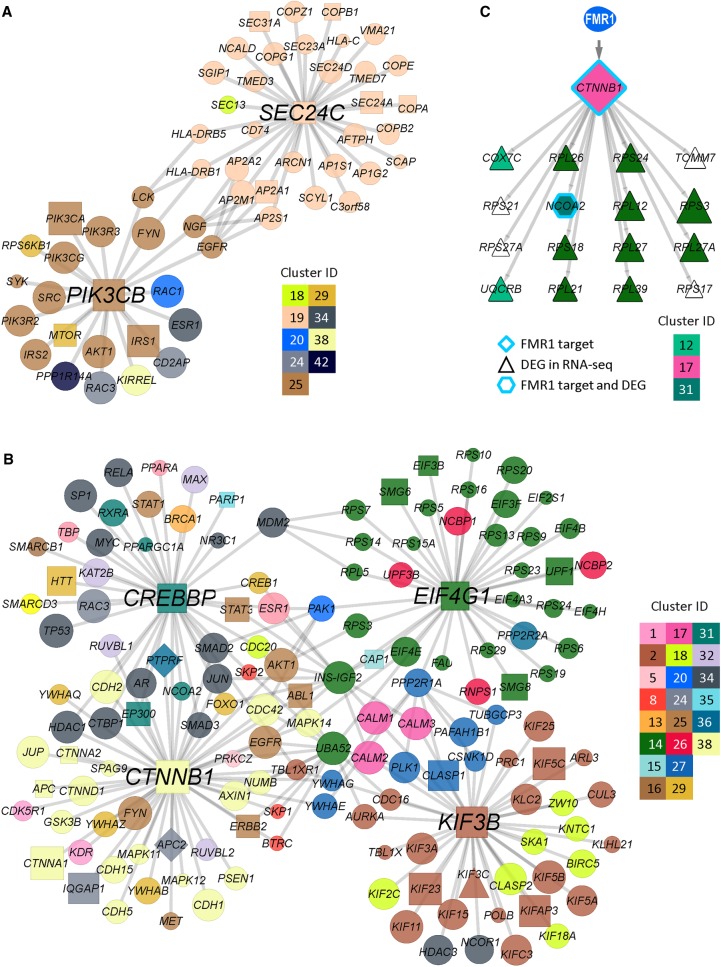
Figure 5.
Hub genes and subnetworks in neural cells. (A,B) Hubs in dNeuron (A) and vNeuron (B) and the subnetworks consisting of the first neighbor genes of hubs. Node shapes discriminate between hits and nonhits and different types of hits. CLIP-seq target (square), RNA-seq DEG (triangle), both (diamond), and network prioritized genes (circle). Node sizes correspond to diffusion score, and node colors correspond to cluster assignments. (C) A proposed model of the relationship between FMR1 CLIP-seq targets and DEGs. Here, CTNNB1, which has been identified as an FMR1 direct target, encodes a predicted transcription factor regulating 16 DEGs. Node sizes and colors correspond to diffusion score and cluster assignment, respectively.

