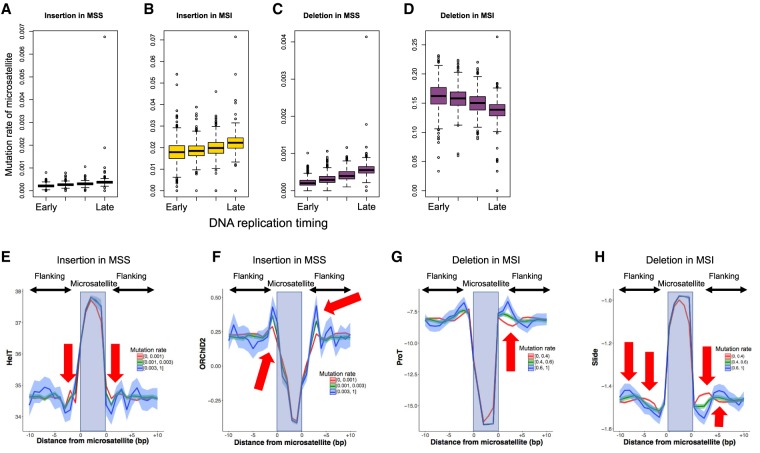
Figure 2.
Analysis of mutation rate of each microsatellite. The mutation rates of 198,578 informative microsatellites were analyzed. (A–D) Association of replication timing with insertion and deletion rates. The edges of the boxes represent the 25th and 75th percentile values. The whiskers represent the most extreme data points, which are no more than 1.5 times the interquartile range from the boxes. (A) Insertions in MSS samples (χ2 test; P-value < 1 × 10−200); (B) insertions in MSI samples (χ2 test; P-value < 1 × 10−200); (C) deletions in MSS samples (χ2 test; P-value < 1 × 10−200); (D) deletions in MSI samples (χ2 test; P-value < 1 × 10−200). (E–H) Association of DNA shape with mutation rate. The top 1000 A/T microsatellites with 10- to 30-bp length were used for the analysis. The microsatellites were divided into the three categories based on the mutation rate. (E) Helix twist (HelT) of insertions in MSS samples; (F) the ·OH Radical Cleavage Intensity (ORChID2) of insertions in MSS samples; (G) Propeller Twist (ProT) of deletions in MSI samples; (H) slide of deletions in MSI samples. In this figure, we divided the microsatellites with mutation rates (0–0.001, 0.001–0.003, and greater than 0.003 for MSS; 0–0.4, 0.4–0.8, and greater than 0.8 for MSI) and showed the DNA shape values. The arrows show base positions with significant association between the DNA shape values and mutation rates (Supplemental Table S4).

