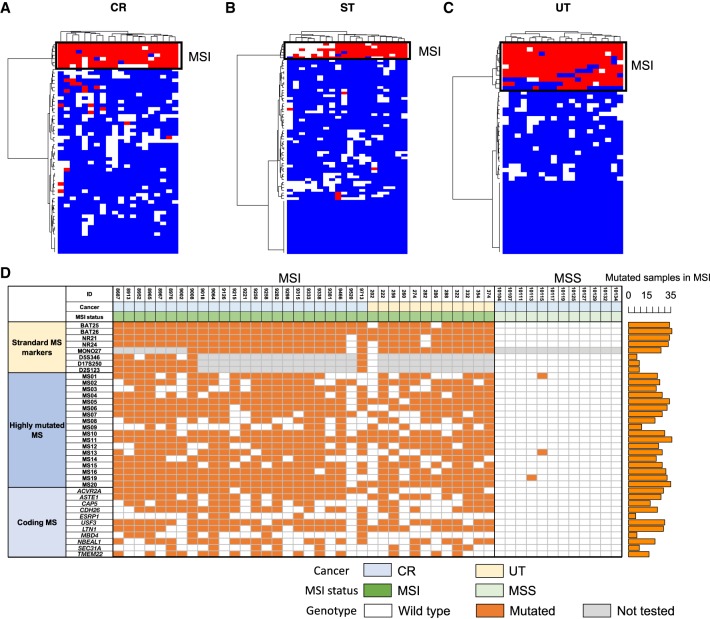
Figure 3.
Highly mutated microsatellite markers. Result of clustering analysis with the top 20 microsatellites. (A) Colon/rectum (CR) cancer; (B) stomach (ST) cancer; (C) uterus (UT) cancer. Mutation status for the 20 microsatellites in each sample are shown. Colors indicates mutation status of each microsatellite (red, mutated; blue, unmutated; and white, unanalyzed owing to low depth). (D) Result of validation study in the independent CR and UT cancer cohort (n = 48). MSI status was defined by BAT25, BAT26, NR21, NR24, MONO27, D5S346, D17S250, and D2S123. Standard microsatellite markers, 18 highly mutated microsatellites, and homopolymers in coding regions were analyzed by MiSeq (Supplemental Fig. S19). Number of mutated samples in the MSI samples are shown in the bar plot (right). Colors indicates mutation status of each microsatellite (orange, mutated; white, unmutated; and gray, not tested). (MS) Microsatellite.

