Figure 2.
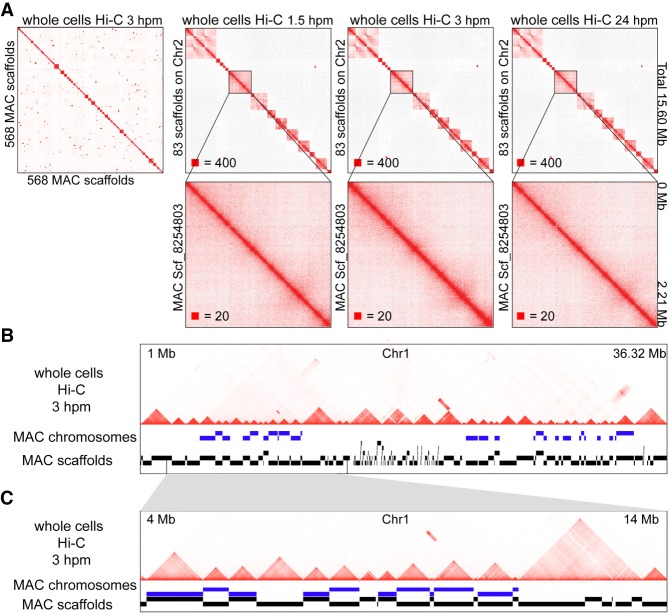
The square-shaped interaction patterns in the MAC of T. thermophila are chromosome territories. (A) Heatmaps showing the chromosome interactions on the 568 MAC scaffolds (ordered by their locations on the MIC genome) at 3 hpm (whole cells Hi-C data mapped to the MAC scaffolds), and the chromosome interactions of the 83 MAC scaffolds located on the MIC Chromosome 2 at 1.5 hpm, 3 hpm, and 24 hpm. Zoomed-in views of scf_8254803 are shown at the bottom. (hpm) Hours post-mixing. Numbers at the lower left of heatmaps correspond to the maximum signal in the matrix. (B,C) The MAC chromosomes (MAC scaffolds with telomere sequences at both ends) and the MAC scaffolds compared to the chromosome interactions on MIC Chromosome 1 at 3 hpm are shown (whole cells Hi-C data mapped to the MIC genome). Regions from 1 Mb to 36.32 Mb (B); zoomed in region from 4 Mb to 14 Mb (C).

