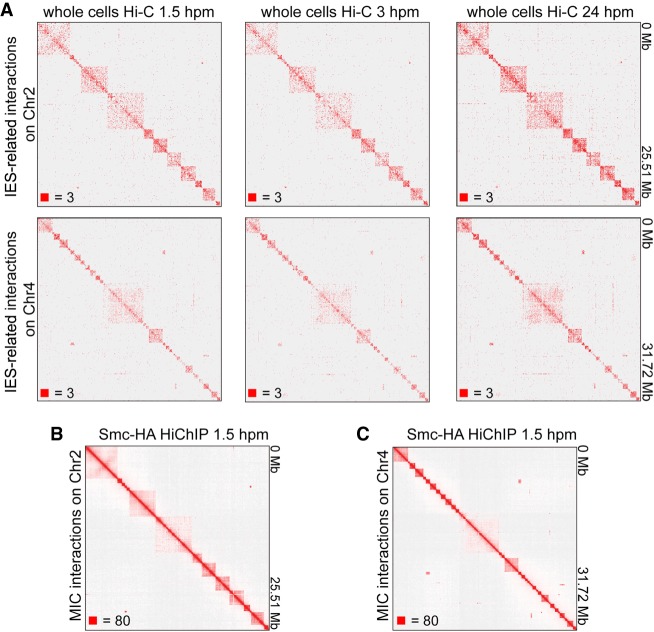
Figure 4.
IES-associated interactions of T. thermophila show TAD-like structures in the MIC. (A) Heatmaps showing the IES-associated Hi-C interactions on Chromosome 2 (top) and Chromosome 4 (bottom) at 1.5 hpm, 3 hpm, and 24 hpm (left to right). (B,C) Heatmaps showing the chromosome interactions at 1.5 hpm on Chromosome 2 (B) and Chromosome 4 (C) (Smc1-HA HiChIP data). Numbers at the lower left of heatmaps correspond to the maximum signal in the matrix.

