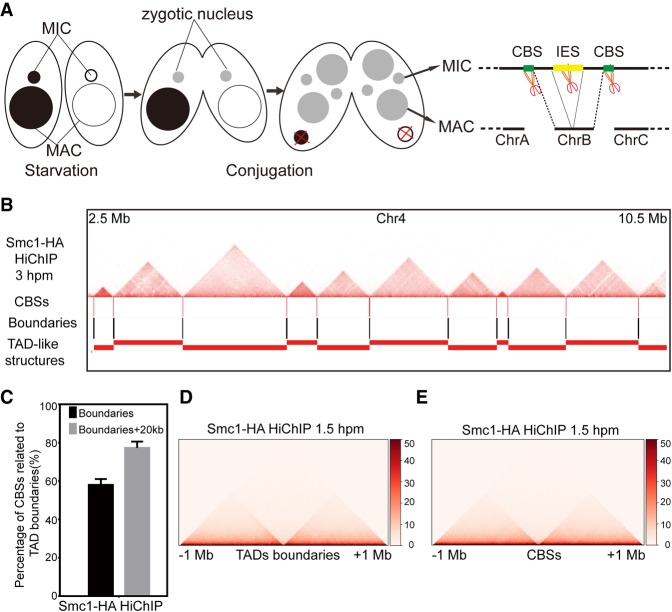
Figure 5.
Boundaries of TAD-like structures in the MIC are consistent with CBS sites. (A) The schematic diagram shows the development of MAC and MIC from the same zygotic nuclei during conjugation. (B) The location of CBS sites, boundaries, and TAD-like structures compared to the heatmaps on the Chromosome 4 (2.5 Mb to 10.5 Mb) at 3 hpm. (C) The bar plot shows percentage of CBS sites localized to the boundaries of the TAD-like structures (10 kb) or 20 kb around the boundaries (total 50 kb). (D) Heatmaps showing averaged Hi-C interaction counts (Smc1-HA HiChIP, 1.5 hpm) around the boundaries of TAD-like structures. (E) Heatmaps showing averaged Hi-C interaction counts (Smc1-HA HiChIP, 1.5 hpm) around the CBS sites.

