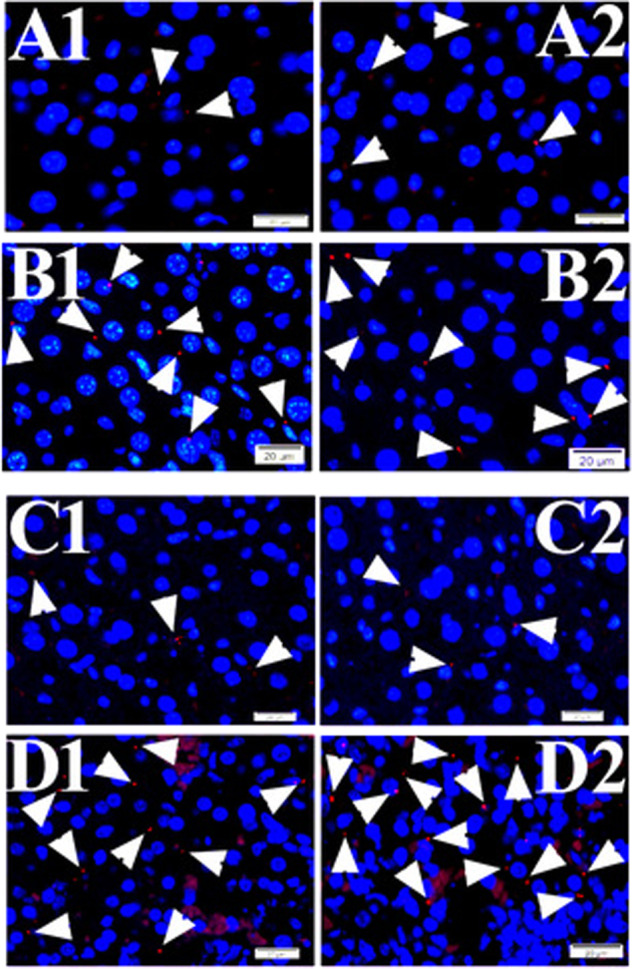
Fig. 4. PLA signals of TVSPs in the tissue of mouse liver.

Representative PLA signals (red) of TVSPs (arrowheads) in liver tissues from mock at BSL3 (a1, a2), mock at BSL4 (c1, c2), rickettsial infection (b1, b2), and Ebola infection (d1, d2) groups. Nuclei were counter-stained with DAPI (blue). Scale bars indicate 20 µm.
