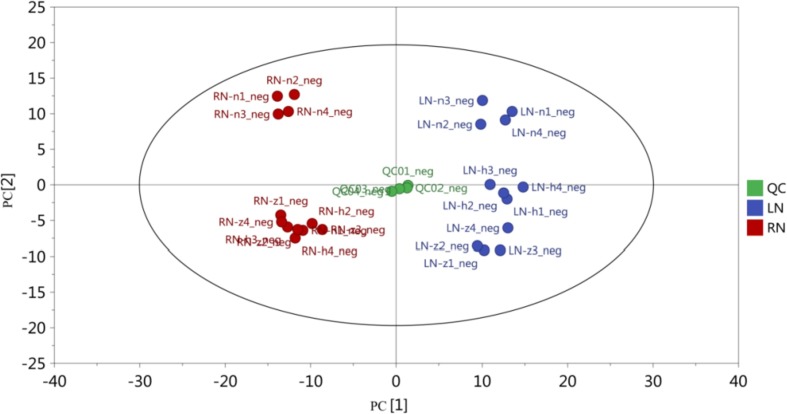
Fig. 1.
Score scatter plot for PCA model TOTAL with QC of all samples under different nitrogen levels. The abscissa PC [1] and the ordinate PC [2] represent the scores of the first and second ranked principal components, respectively, and the scatter color and shape represent experimental groupings of the samples. The differences between the visible groups are significantly different on the top principal components. The samples are all within the 95% confidence interval (Hotelling's T-squared ellipse).

